Image by rawpixel.com on Freepik
No matter what business you are in, knowing how to analyze data is more important than ever in the data-driven era. Data analysis would enable businesses to stay competitive and provide the ability to make better decisions.
The importance of data analysis drives every individual to know how to perform data analysis. However, sometimes it takes too much time to conduct data analysis. That’s why we could rely on ChatGPT to create a complete report from our data file.
This article will explore five simple steps to create complete analytical reports from your CSV file. These five steps include:
Step 1: Importing the CSV File
Step 2: Data Summary and Preprocessing
Step 3: Data Analysis
Step 4: Data Visualization
Step 5: Report Generation
As a prerequisite, this article assumes that the reader has subscribed to ChatGPT Plus. With that in mind, let’s get started.
The first step is to prepare the CSV file that you want to analyze and create a report. This file could come from any trustworthy source, but this article would use the Telecom Churn dataset from Kaggle.
Ensure the data is structured, organized, and has a clear header. If you have a certain target that you want to analyze, then don’t forget to include that data in the file. In our example, we would try to perform an analysis for the churn column.
With the data ready, attach them to the ChatGPT and let the model do their work.
The next step is to get the data summary from our CSV file and preprocess them. Input the following prompt while you upload the data.
Provide the data summary to this file and perform appropriate data processing for the dataset.The above prompt provides the following results:
Here's the summary of your dataset:
Number of Rows: 3333
Number of Columns: 11
Column Names:
Churn
AccountWeeks
ContractRenewal
DataPlan
DataUsage
CustServCalls
DayMins
DayCalls
MonthlyCharge
OverageFee
RoamMins
Data Types:
Integer: Churn, AccountWeeks, ContractRenewal, DataPlan, CustServCalls, DayCalls
Float: DataUsage, DayMins, MonthlyCharge, OverageFee, RoamMins
Missing Values: There are no missing values in any of the columns.
ChatGPT clearly could read the data well and was able to provide the given dataset. The next result is the data preprocessing from the ChatGPT.
Since there are no missing values in the dataset, the main focus of data cleaning and preprocessing will be on:
- Checking for any outliers or anomalies in the data.
- Normalizing or standardizing the data if required, especially for columns with continuous numerical values.
- Converting categorical data into a format suitable for analysis, if necessary.
Let's proceed with these steps.
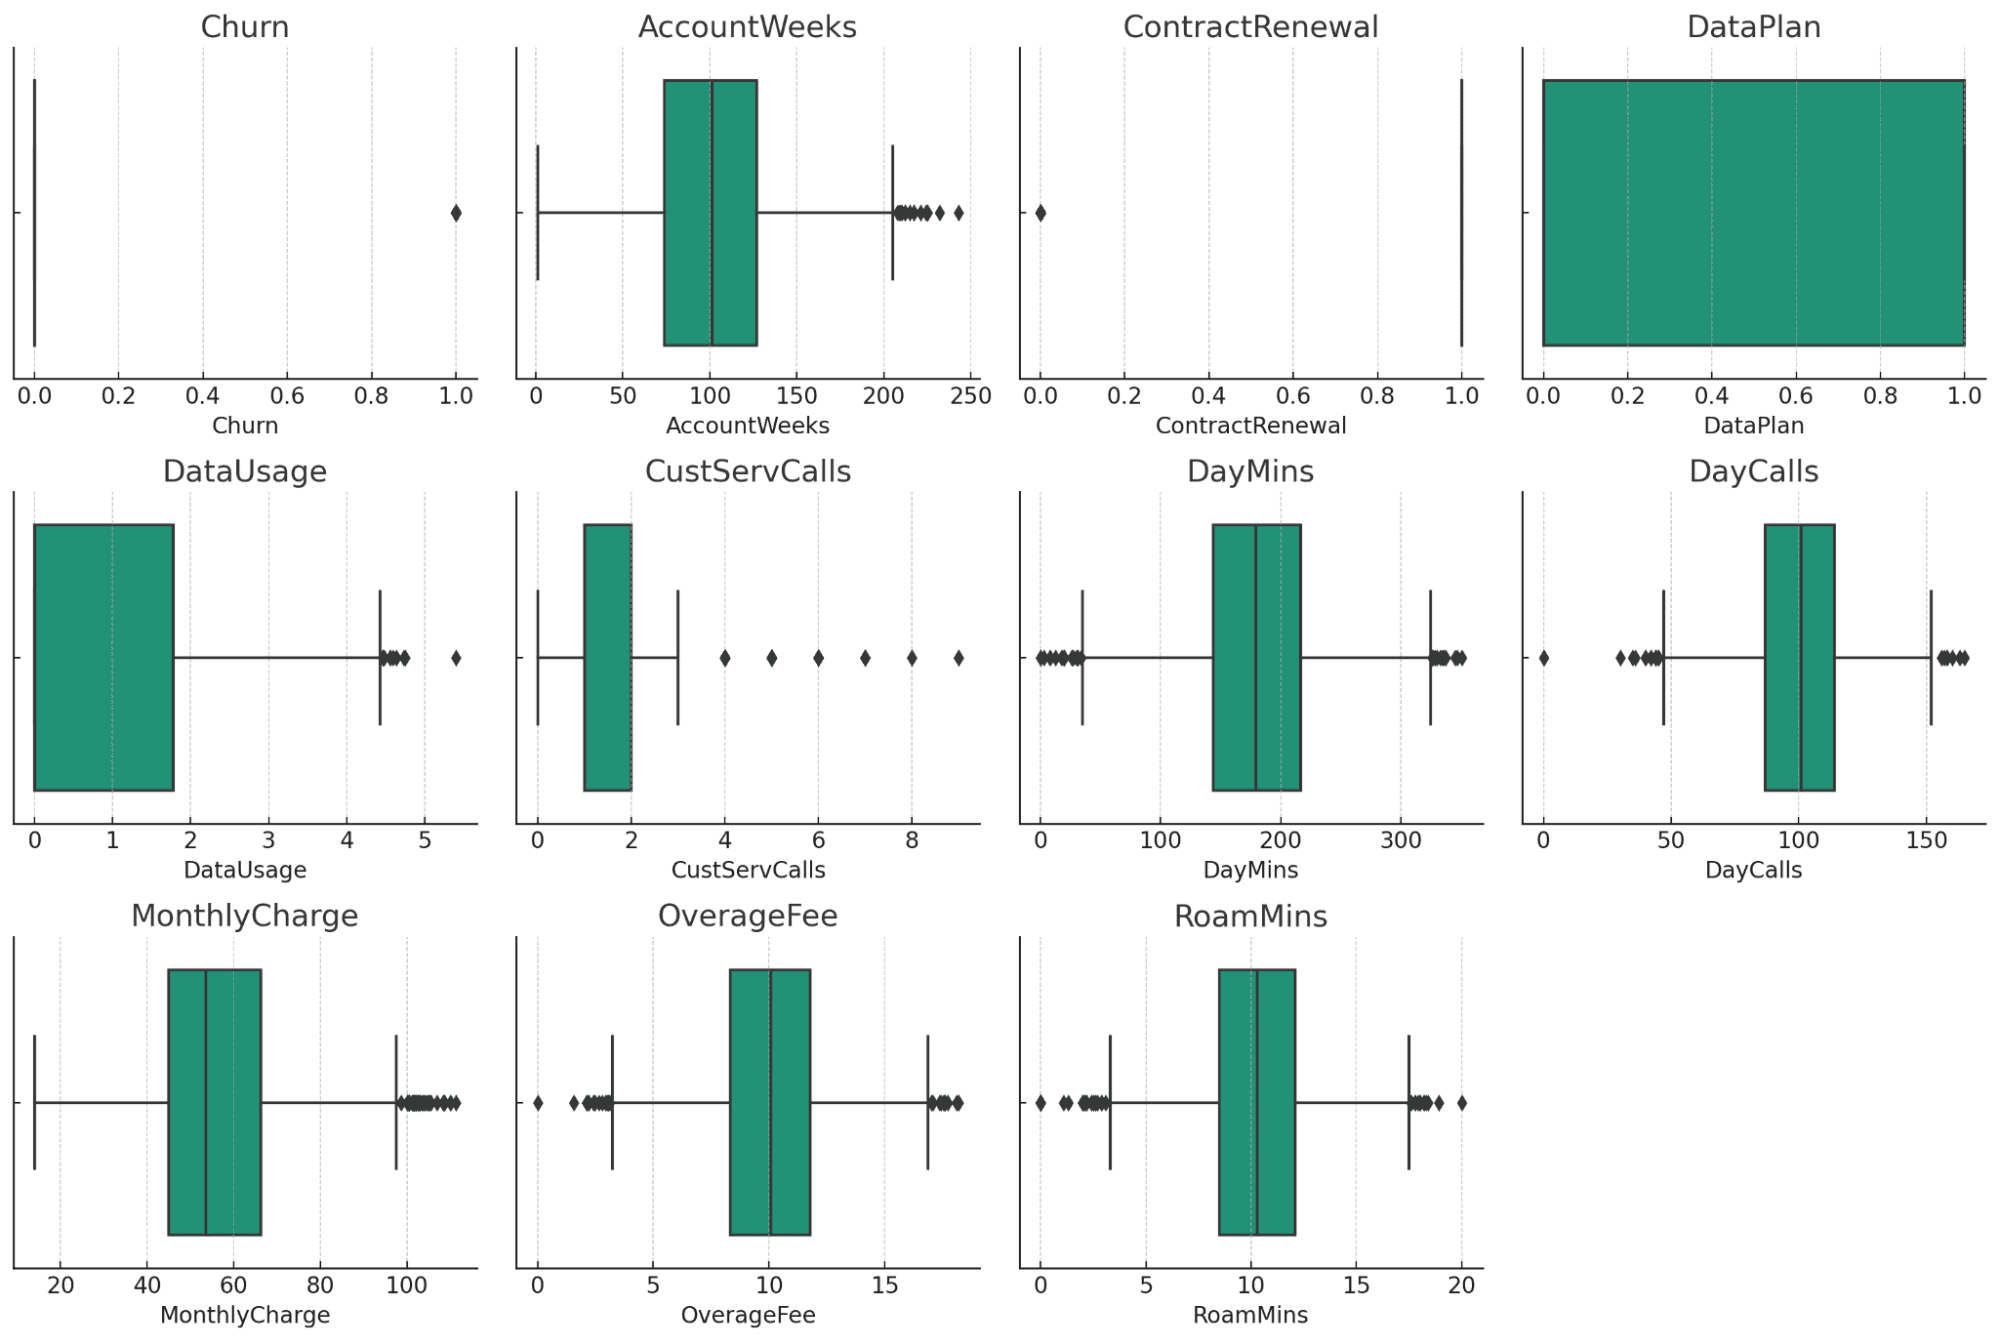
The boxplots provide a visual overview of potential outliers in each numerical column of your dataset. Here are some observations:
- AccountWeeks, CustServCalls, DayCalls: These columns show a fairly normal distribution with a few outliers.
- DataUsage, DayMins, MonthlyCharge, OverageFee, RoamMins: These columns also show some outliers, but they seem to be within a reasonable range, considering the nature of the data.
- Churn, ContractRenewal, DataPlan: Being categorical/binary data, these columns don't show traditional outliers.
Given this information, the next steps in data cleaning and preprocessing could include:
- Handling Outliers: We can decide whether to remove, cap, or otherwise handle outliers based on your specific analytical needs and domain knowledge.
- Data Transformation: If needed, we can normalize or standardize columns like DayMins, MonthlyCharge, etc., especially if you plan to use algorithms that are sensitive to the scale of data.
- Categorical Data Encoding: Convert categorical data into a format suitable for analysis, if any such transformation is required.
You can let the ChatGPT perform additional steps for the data cleaning and preprocessing or let it be as it is. For this example, we would continue to the next steps.
Next, we would perform data analysis with ChatGPT. The data analysis is depending on what you want to achieve. In our case, we want to perform data analysis from the Churn POV.
We use the following prompt to execute the data analysis with ChatGPT for the above case.
Please perform the data analysis based on the data above with respect to the churn data.
The data analysis can be seen in the following result.
To perform data analysis with respect to the churn data, we'll focus on understanding how different factors relate to customer churn. Churn, being a binary variable (0 for no churn, 1 for churn), is typically analyzed through classification methods and by examining relationships with other variables. Here's the plan:
- Correlation Analysis: To start, we'll look at how each numerical feature correlates with churn. This gives us an initial understanding of which factors might be more closely related to churn.
- Statistical Tests: For categorical variables like ContractRenewal and DataPlan, we can use statistical tests to see if there are significant differences in churn rates across different categories.
- Visual Analysis: We'll create some visualizations to further explore these relationships. This includes comparing churn rates across different groups and plotting key variables against churn.
- Summary Statistics: We'll provide summary statistics for different groups based on churn status to see if there are noticeable differences in means or distributions.
Let's start with the correlation analysis and then move on to the next steps.
Correlation Analysis with Churn
The correlation of different variables with churn is as follows (from strongest negative to strongest positive correlation):
Negative Correlation:
- ContractRenewal: Strongest negative correlation. Indicates that customers who do not renew their contracts are more likely to churn.
- DataPlan: Customers without a data plan are slightly more likely to churn.
- DataUsage: Higher data usage slightly decreases the likelihood of churn.
Positive Correlation:
- AccountWeeks, DayCalls: Very weak positive correlation, suggesting minimal impact on churn.
- RoamMins: A slight increase in churn likelihood with increased roaming minutes.
- MonthlyCharge: Slightly higher churn rates with increased monthly charges.
- OverageFee: Higher overage fees are moderately correlated with increased churn.
- DayMins: Higher daily minutes are moderately correlated with increased churn.
- CustServCalls: Strong positive correlation. More customer service calls are associated with higher churn rates.
Based on these correlations, it seems that factors like contract renewal, customer service calls, daily minutes, and overage fees are more closely related to churn. We can further explore these factors through visual analysis and statistical tests, especially for categorical variables like ContractRenewal and DataPlan.
Visual Analysis
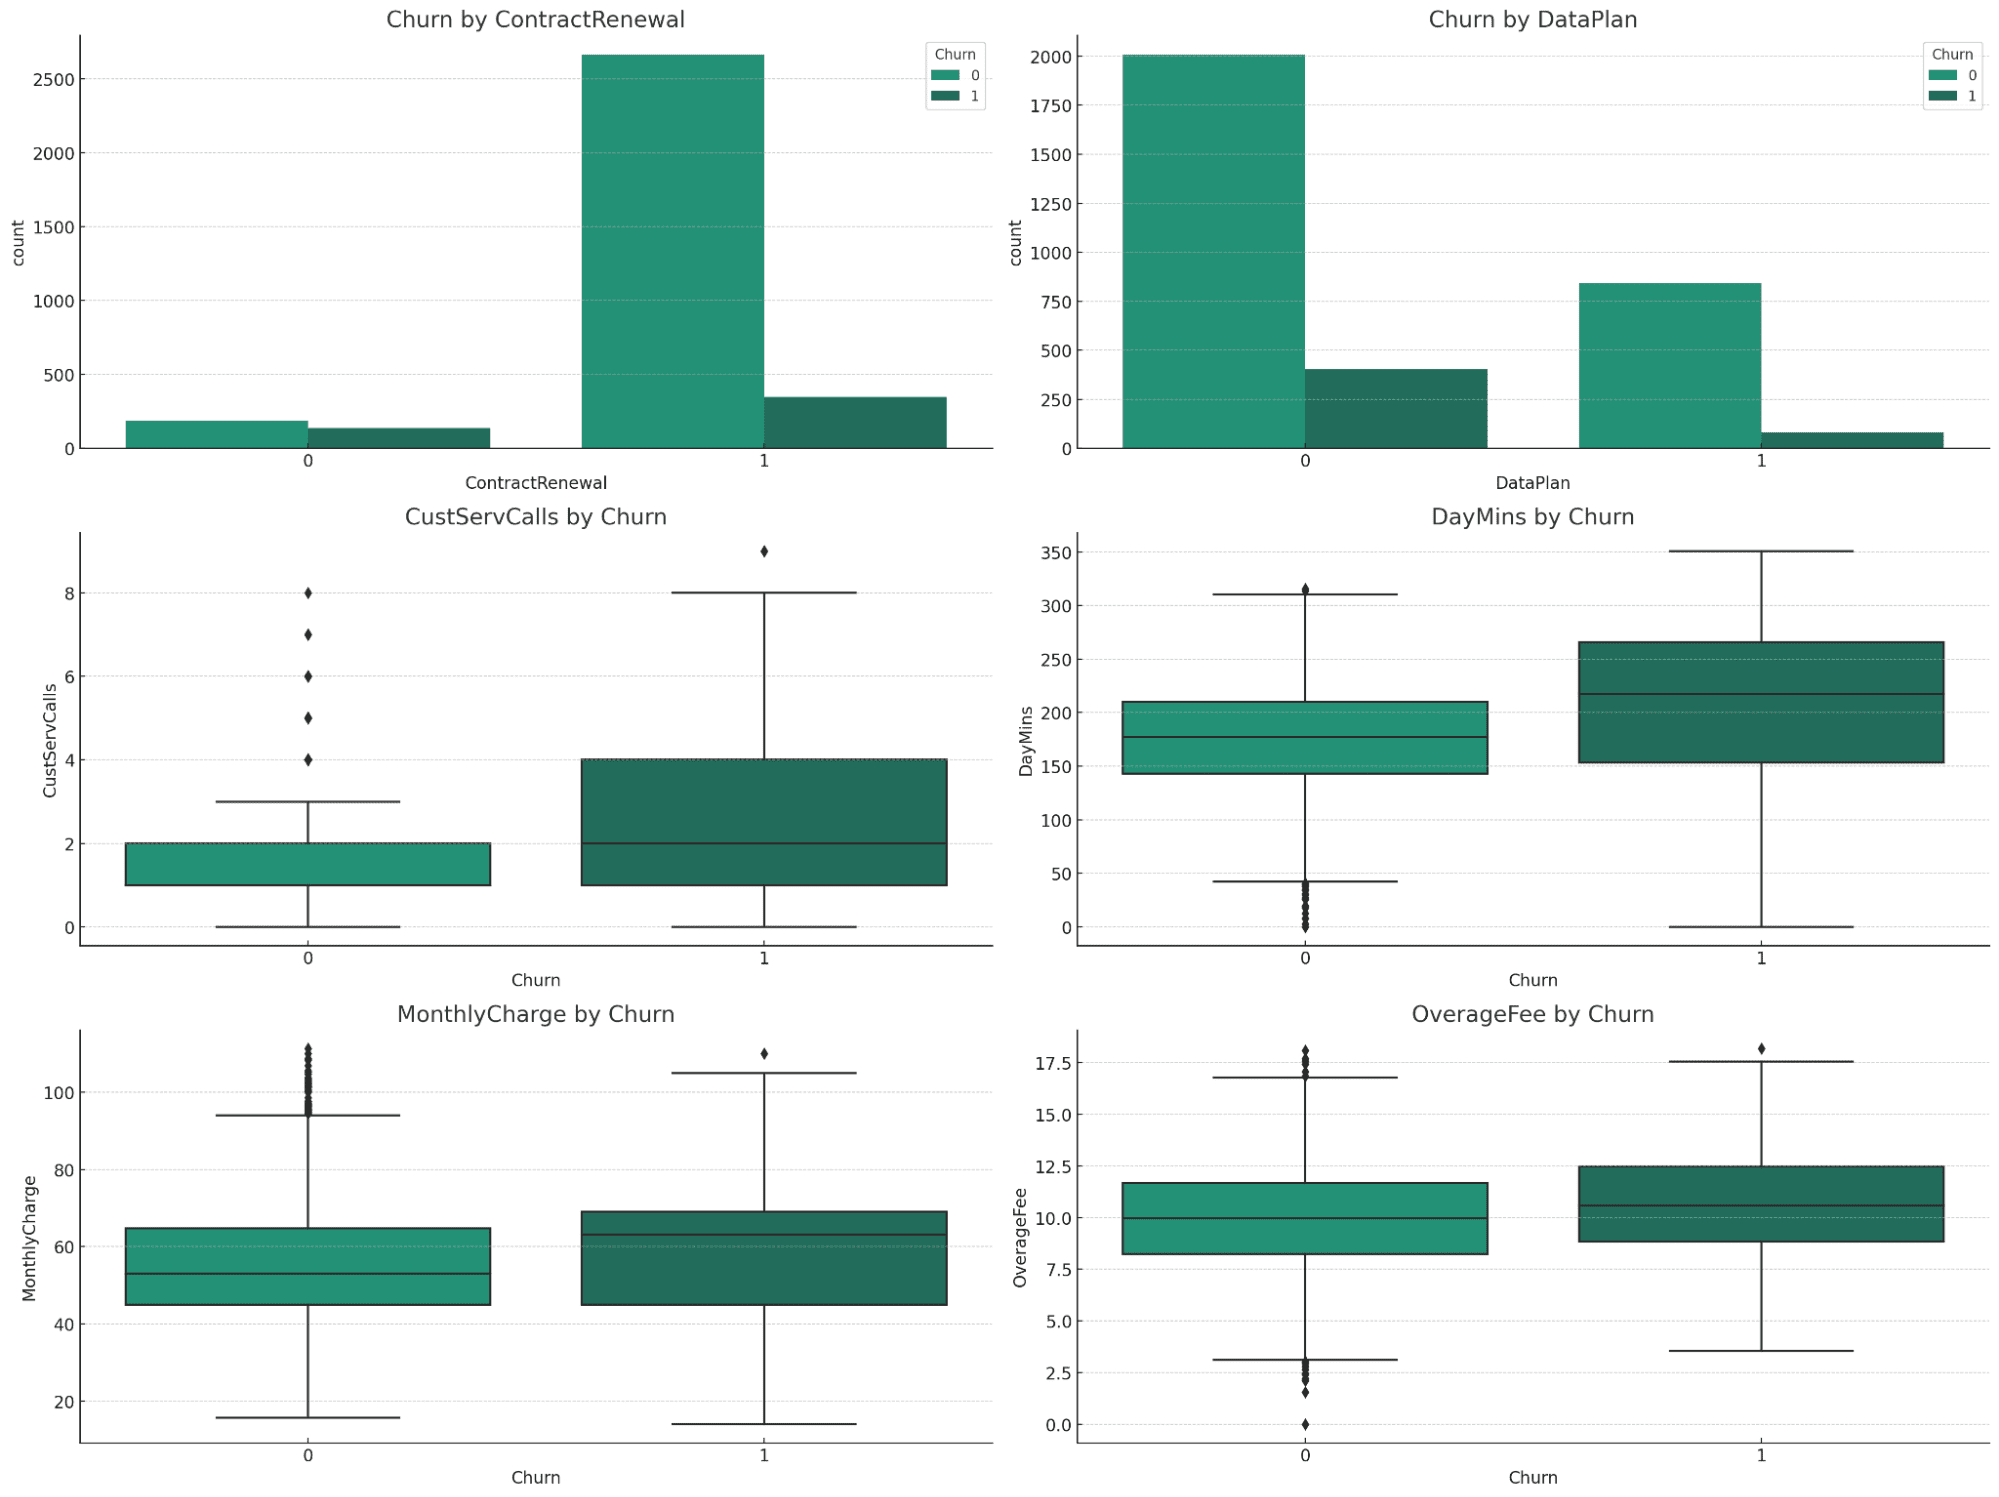
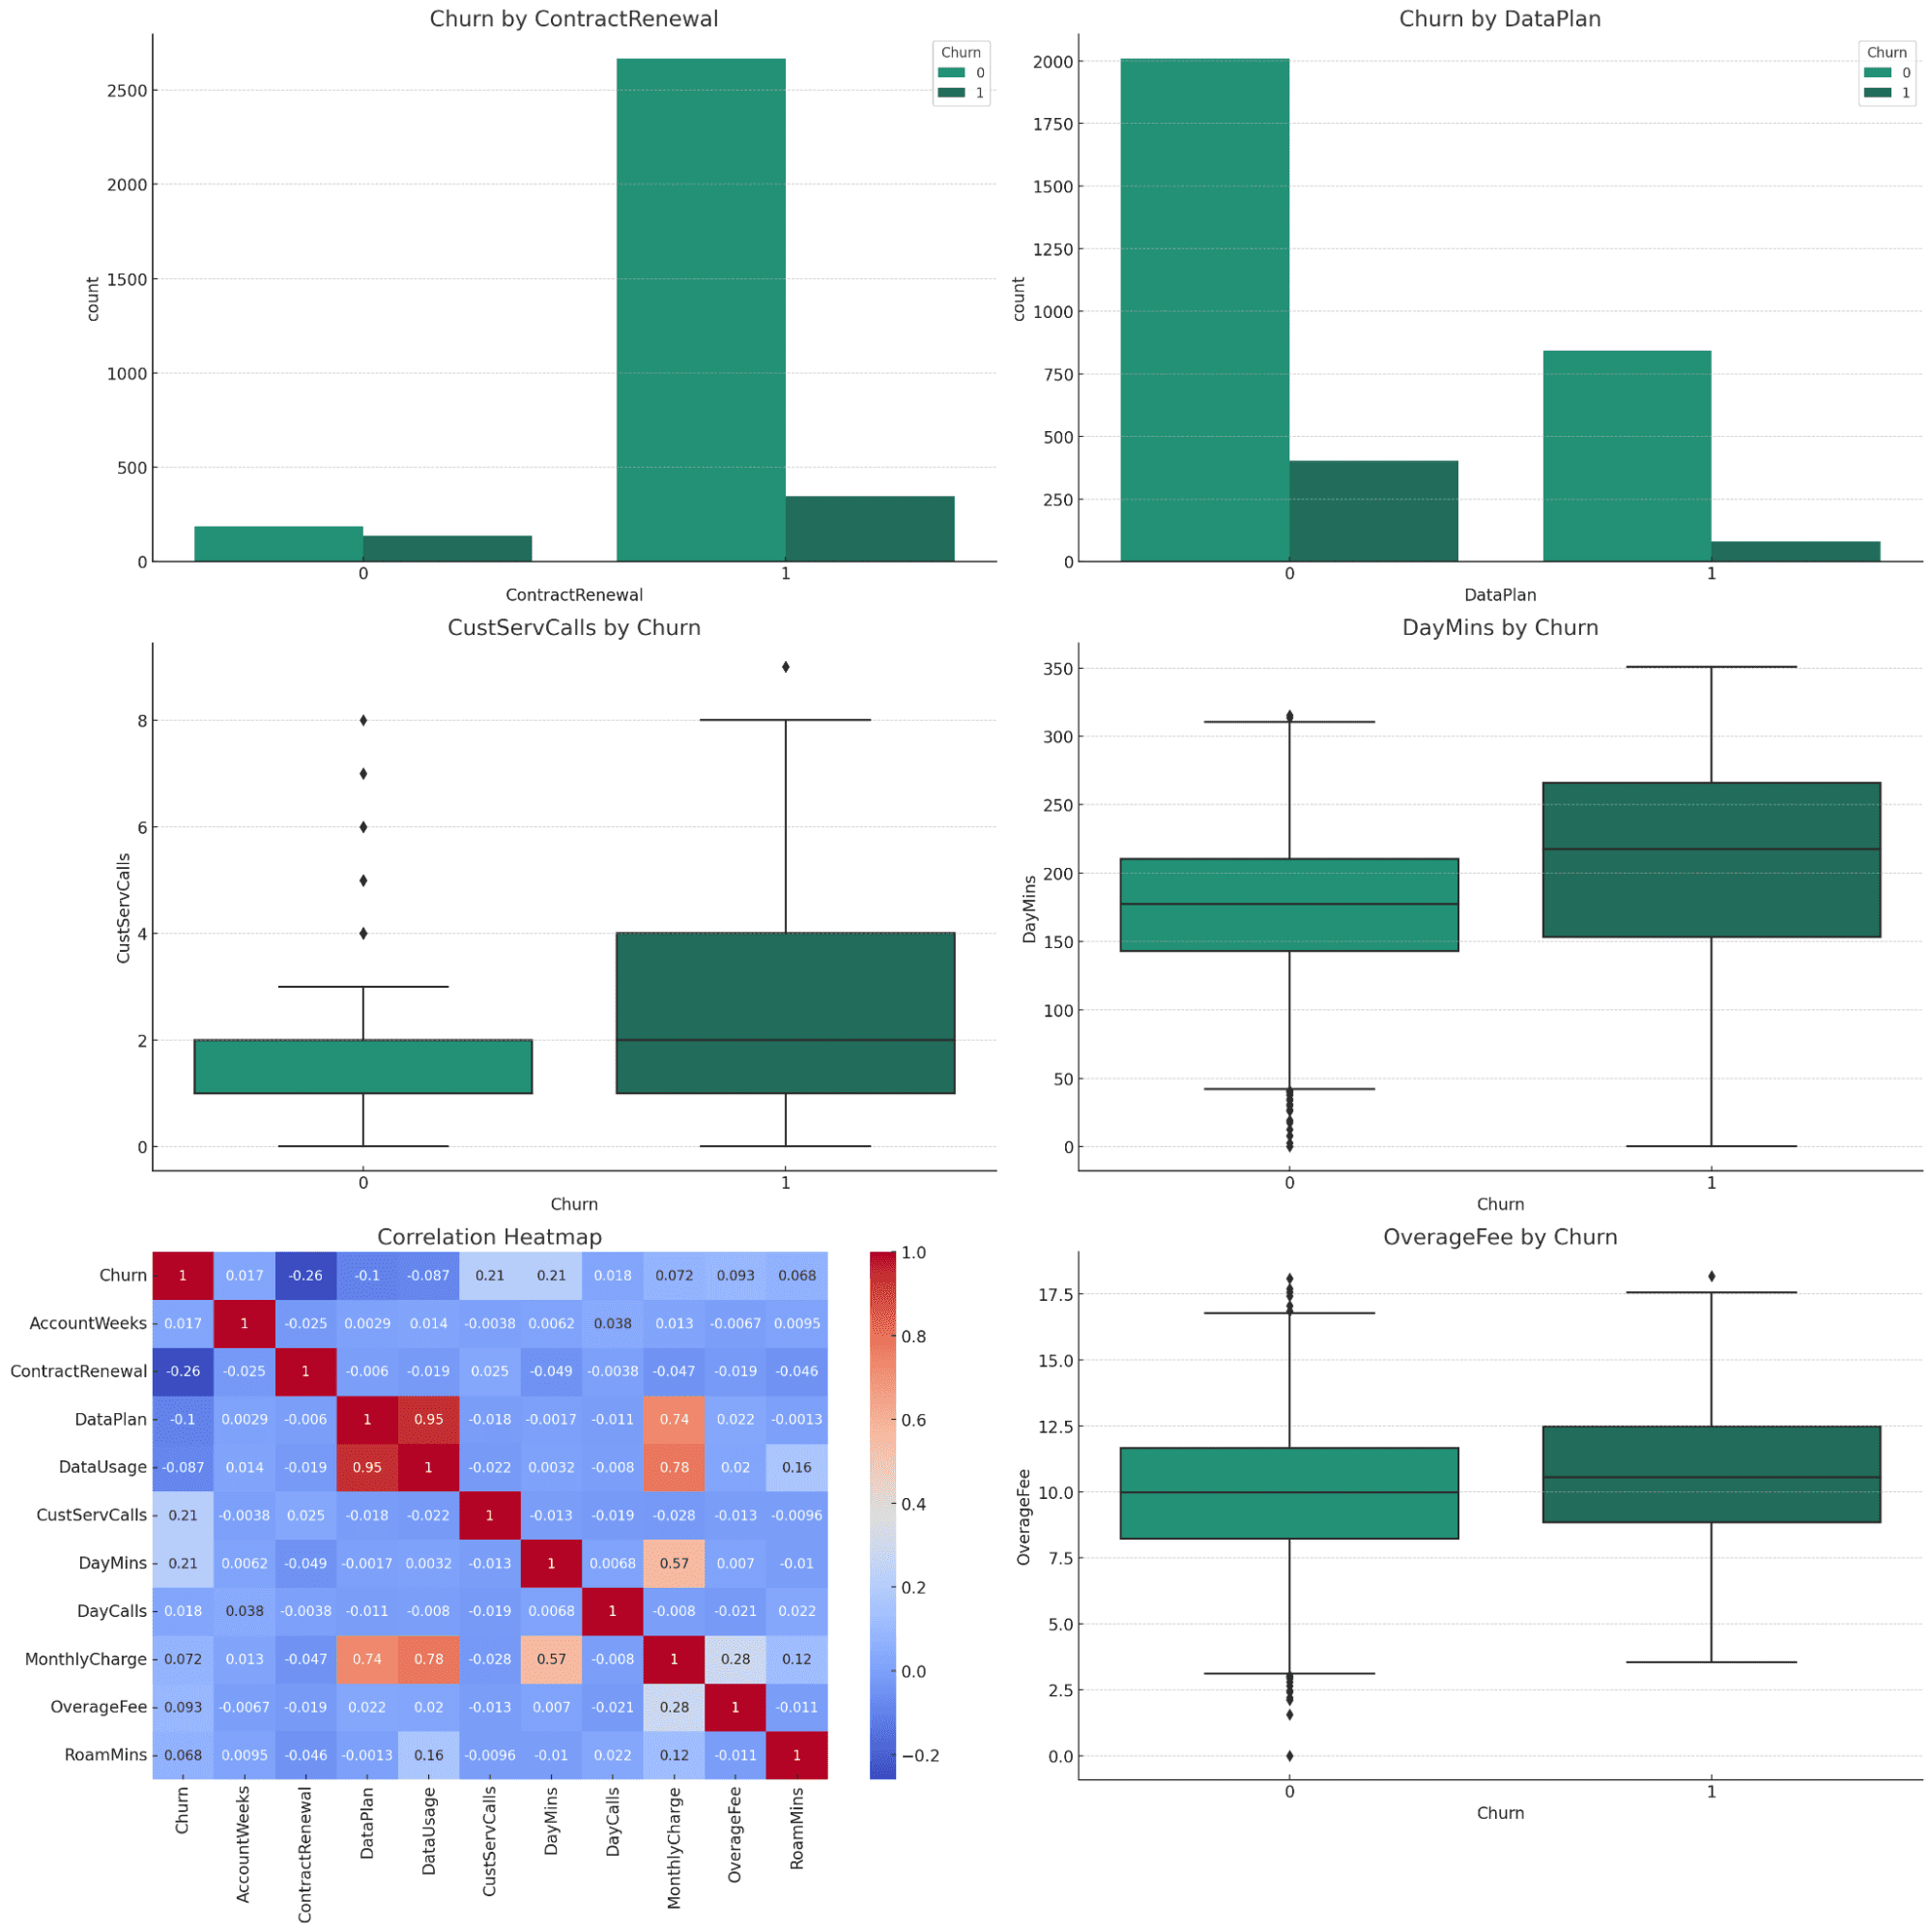
The visualizations offer valuable insights into the relationship between different variables and churn:
Churn by ContractRenewal and DataPlan:
- ContractRenewal: A significant difference in churn rates is evident. Customers who did not renew their contracts show a higher rate of churn.
- DataPlan: There is a noticeable difference in churn rates based on whether customers have a data plan or not, with those without a data plan showing higher churn.
Numerical Variables (CustServCalls, DayMins, MonthlyCharge, OverageFee) by Churn:
- CustServCalls: Customers with higher numbers of customer service calls tend to churn more.
- DayMins: Higher daily minutes are associated with a greater likelihood of churn.
- MonthlyCharge: Higher monthly charges correlate with an increased churn rate.
- OverageFee: Higher overage fees are also associated with increased churn.
Conclusions from the Analysis
- Contract renewal status and the presence of a data plan are significant factors in customer churn.
- High usage (in terms of day minutes) and high charges (monthly charges and overage fees) are associated with higher churn rates.
- A higher number of customer service calls is a strong indicator of potential churn.
Next Steps
Based on these insights, targeted strategies can be developed to reduce churn, such as improving customer service, revising pricing strategies, or offering incentives for contract renewal and data plan subscriptions.
With a single prompt, we can see how well ChatGPT could give us the complete data analysis and come up with insight from the data. You can tweak the analysis aims and start from there.
The data visualization is a supportive activity to improve the data analysis and overall report. By having the visualization, we can have a more comprehensive report to understand our data.
Using the following prompt, we can perform the data visualization with ChatGPT.
Please perform data visualization from the data analysis to explain the data better.To enhance the understanding of the data analysis results, I'll create a series of visualizations that clearly depict the key findings related to customer churn. These visualizations will include:
- Bar Plots for Categorical Variables:
- Comparing churn rates for customers with and without contract renewal.
- Comparing churn rates for customers with and without a data plan.
- Box Plots for Key Numerical Variables:
- Customer Service Calls vs Churn.
- Daily Minutes vs Churn.
- Monthly Charges vs Churn.
- Overage Fees vs Churn.
- Heatmap of Correlation:
To visualize the correlation of all variables with churn.
The visualization would show all the important plots that encapsulate the whole dataset. We can ask for more detailed descriptions for each plot, which you can try independently.
The last step is to generate the report based on the previous steps. Unfortunately, ChatGPT might not capture all the description and insight from the data analysis, but we can still have the simple version of the report.
Use the following prompt to generate a PDF report based on the previous analysis.
Please provide me with the pdf report from the first step to the last step.You will get the PDF link result with your previous analysis covered. Try to iterate the steps if you feel the result is inadequate or if there are things you want to change.
Data analysis is an activity that everyone should know as it’s one of the most required skills in the current era. However, learning about performing data analysis could take a long time. With ChatGPT, we can minimize all that activity time.
In this article, we have discussed how to generate a complete analytical report from CSV files in 5 steps. ChatGPT provides users with end-to-end data analysis activity, from importing the file to producing the report.
Cornellius Yudha Wijaya is a data science assistant manager and data writer. While working full-time at Allianz Indonesia, he loves to share Python and Data tips via social media and writing media.
- SEO Powered Content & PR Distribution. Get Amplified Today.
- PlatoData.Network Vertical Generative Ai. Empower Yourself. Access Here.
- PlatoAiStream. Web3 Intelligence. Knowledge Amplified. Access Here.
- PlatoESG. Carbon, CleanTech, Energy, Environment, Solar, Waste Management. Access Here.
- PlatoHealth. Biotech and Clinical Trials Intelligence. Access Here.
- Source: https://www.kdnuggets.com/from-csv-to-complete-analytical-report-with-chatgpt-in-5-simple-steps?utm_source=rss&utm_medium=rss&utm_campaign=from-csv-to-complete-analytical-report-with-chatgpt-in-5-simple-steps
- :has
- :is
- :not
- $UP
- 1
- 7
- a
- ability
- Able
- About
- above
- Achieve
- across
- activity
- Additional
- against
- aims
- algorithms
- All
- Allianz
- also
- an
- analysis
- Analytical
- analyze
- analyzed
- and
- any
- appropriate
- ARE
- article
- AS
- ask
- Assistant
- associated
- assumes
- At
- attach
- bar
- based
- BE
- being
- Better
- between
- Box
- business
- businesses
- but
- by
- Calls
- CAN
- cap
- capture
- case
- categories
- certain
- change
- charges
- ChatGPT
- checking
- classification
- Cleaning
- clear
- clearly
- closely
- Column
- Columns
- come
- comparing
- competitive
- complete
- comprehensive
- Conduct
- considering
- continue
- continuous
- contract
- contracts
- convert
- converting
- correlated
- Correlation
- correlations
- could
- covered
- create
- Current
- customer
- Customer Service
- Customers
- daily
- data
- data analysis
- data processing
- data science
- data visualization
- data-driven
- day
- decide
- decisions
- decreases
- Depending
- description
- detailed
- developed
- DID
- difference
- differences
- different
- discussed
- distribution
- distributions
- do
- domain
- don
- Dont
- drives
- each
- enable
- encoding
- end-to-end
- enhance
- Era
- especially
- etc
- EVER
- Every
- everyone
- evident
- Examining
- example
- execute
- Explain
- explore
- factors
- fairly
- Feature
- feel
- Fees
- few
- File
- Files
- findings
- First
- five
- Focus
- following
- follows
- For
- format
- from
- further
- generate
- get
- Give
- given
- gives
- greater
- Group’s
- handle
- Handling
- Have
- having
- he
- here
- High
- higher
- How
- How To
- However
- HTTPS
- i
- if
- Impact
- importance
- important
- importing
- improve
- improving
- in
- Incentives
- include
- includes
- Increase
- increased
- independently
- indicates
- Indicator
- individual
- Indonesia
- information
- initial
- input
- insight
- insights
- into
- IT
- jpg
- KDnuggets
- Key
- Know
- Knowing
- knowledge
- Last
- learning
- let
- like
- likelihood
- likely
- LINK
- ll
- Long
- long time
- Look
- loves
- Main
- make
- manager
- Matter
- me
- means
- Media
- methods
- might
- mind
- minimal
- minimize
- minutes
- missing
- model
- monthly
- more
- most
- move
- much
- names
- Nature
- necessary
- needed
- needs
- negative
- next
- no
- normal
- number
- numbers
- observations
- of
- offer
- offering
- on
- ONE
- or
- Organized
- Other
- otherwise
- our
- overall
- overview
- perform
- performing
- plan
- plato
- Plato Data Intelligence
- PlatoData
- plus
- positive
- potential
- Prepare
- presence
- previous
- pricing
- proceed
- processing
- producing
- provide
- provides
- Python
- range
- Rate
- Rates
- Read
- Reader
- ready
- reasonable
- reduce
- related
- relationship
- Relationships
- rely
- remove
- report
- Reports
- required
- respect
- result
- Results
- s
- Scale
- Science
- see
- seem
- seems
- seen
- sensitive
- Series
- service
- Share
- should
- show
- showing
- significant
- Simple
- single
- skills
- Social
- social media
- some
- sometimes
- Source
- specific
- standardizing
- start
- started
- statistical
- statistics
- Status
- stay
- Step
- Steps
- Still
- strategies
- strong
- strongest
- structured
- subscriptions
- such
- suitable
- SUMMARY
- supportive
- T
- Take
- takes
- Target
- targeted
- telecom
- terms
- tests
- than
- that
- The
- their
- Them
- then
- There.
- These
- they
- things
- this
- those
- Through
- time
- tips
- to
- too
- traditional
- Transformation
- trustworthy
- try
- tweak
- typically
- understand
- understanding
- unfortunately
- us
- Usage
- use
- users
- Valuable
- Values
- variable
- version
- very
- via
- visual
- visualization
- visualize
- vs
- want
- was
- we
- WELL
- What
- whether
- which
- while
- WHO
- whole
- why
- will
- with
- within
- without
- Work
- working
- would
- writer
- writing
- you
- Your
- zephyrnet