- Ethereum slumped back under $3,000, but the 100-day support stopped the pulldown, allowing bulls to regain control.
- Ripple bulls’ quest for trading above $1 and toward $1.4 is far from over.
Cryptocurrencies are in the red despite starting the week on a good note. Bitcoin closed in on $44,000 on Monday but closed the day near $42,000. The second-largest crypto-asset Ethereum almost brushed shoulders with $3,200 on the same day but traded marginally below $3,000 at writing.

Although key support areas have been defended almost across the board, for instance, BTC has $40,000; Ether has $2,650 and Cardano $2, investors remain skeptical regarding the uptrend.
Ethereum:-
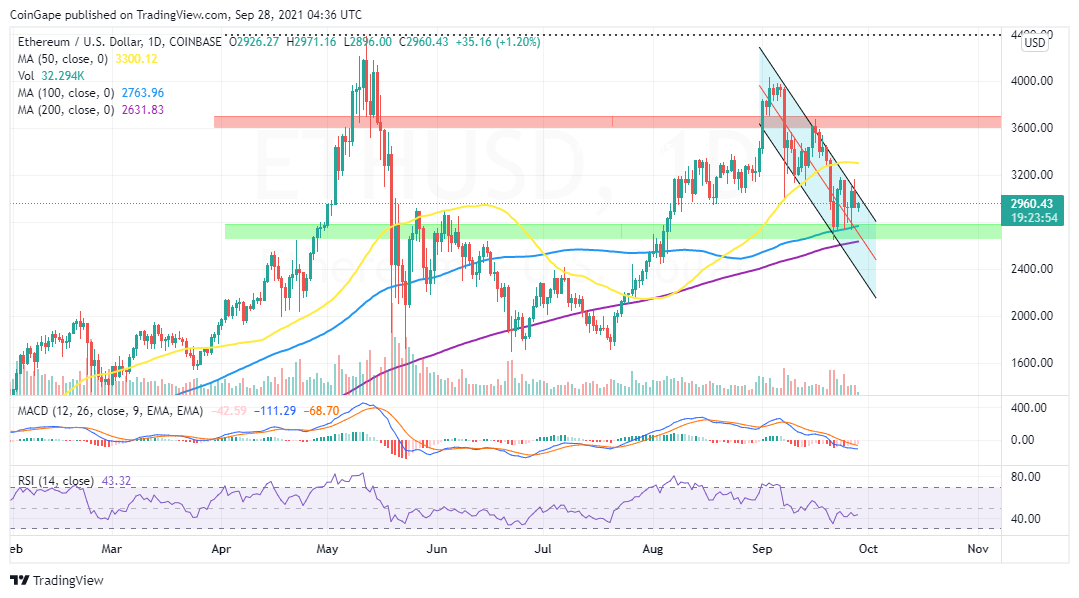
The gigantic smart contract is trading at $2,965 after resting the demand zone in green on the daily chart. Ethereum nearly closed the gap to $3,200 on Monday but ran into acute resistance amid general market instability.
As bears pushed the price lower, it became difficult for bulls to sustain ETH above $3,100 and $3,000, respectively. Intriguingly, support near the 100-day Simple Moving Average (SMA) once again came to the buyers.
The pulldown on Ethereum seems strong, explaining the sharply descending parallel channel. Recovery will likely be a pipe dream as long as the upper boundary is unbroken. Moreover, bulls must target trading and closing the day above $3,200 to shift the technical aspect to the bullish side.
For now, sellers are mainly in control, as highlighted by the MACD and the RSI. Nonetheless, these technical indexes will offer key insights into how Ethereum will react in the subsequent sessions and days.
For instance, a buy signal from the MACD may validate an upswing for Ether while the RSI’s movement above the midline would cement the bulls’ influence on the price.
ETH/USD Daily Chart
Ripple:-
Ripple was forced to revisit the area near $0.9 following a challenging journey toward $1 on Monday. The 200-day SMA contributed significantly to the overhead pressure. Buyers required a confirmed breakout above this level to sustain the uptrend.
The pullback to $0.9 maintained the bearish outlook in the market, accentuated by a month-long sell signal from the MACD. Besides, the RSI affirmed the bearish grip on the price, taking control away from the bulls.
XRP/USD Daily Chart

It is worth noting that the 100-day SMA reinforced the demand zone in green. With this support intact, Ripple will cancel calls for declines to $0.8. On the upside, buyers will have the time to launch an assault on the resistance at the 200-day SMA and $1. Traders should be on the lookout for a real break above these barriers to ascertain the validity of the uptrend.

- "
- 000
- 100
- 9
- Allowing
- analysis
- AREA
- barriers
- bearish
- Bears
- board
- breakout
- BTC
- Bullish
- Bulls
- buy
- closed
- content
- contract
- contributed
- cryptocurrencies
- day
- Demand
- ETH
- ETH/USD
- Ether
- ethereum
- financial
- gap
- General
- good
- Green
- Highlighted
- hold
- How
- HTTPS
- influence
- insights
- investing
- Investors
- IT
- Key
- launch
- Level
- Long
- Market
- market research
- Monday
- Near
- offer
- Opinion
- Outlook
- pipe
- pressure
- price
- Price Analysis
- quest
- React
- recovery
- research
- Ripple
- Ripple Price Analysis
- sell
- Sellers
- Share
- shift
- Simple
- smart
- smart contract
- support
- Target
- Technical
- time
- Traders
- Trading
- week
- worth
- writing
- XRP/USD