Ethereum price is showing bearish signs below $1,700 against the US Dollar. ETH could continue to move down below the $1,600 level.
- Ethereum is down 5% and there was a move below the $1,720 support.
- The price is trading below $1,700 and the 100-hourly Simple Moving Average.
- The bears struggle near a key bearish trend line with resistance near $1,740 on the hourly chart of ETH/USD (data feed via Kraken).
- The pair could struggle to recover above the $1,680 and $1,700 resistance levels.
Ethereum Price Dives 5%
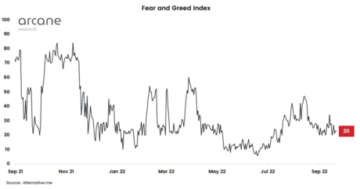
Ethereum’s price failed to gain pace for a move above the $1,780 resistance. ETH reacted to the downside below the $1,720 support after the Fed interest rate decision, similar to Bitcoin.
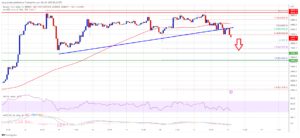
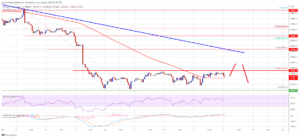
There was a clear move below the $1,700 and $1,640 support levels. The price declined over 5% and traded close to $1,630. A low is formed near $1,630 and the price is now consolidating losses. It is trading below $1,700 and the 100-hourly Simple Moving Average.
There is also a key bearish trend line forming with resistance near $1,740 on the hourly chart of ETH/USD. Immediate resistance is near the $1,660 level or the 23.6% Fib retracement level of the recent drop from the $1,749 swing high to the $1,630 low.
The next major resistance is near the $1,680 level. The first major resistance is near $1,700 or the 61.8% Fib retracement level of the recent drop from the $1,749 swing high to the $1,630 low. A proper move above the $1,680 and $1,700 resistance levels might start a steady recovery wave.
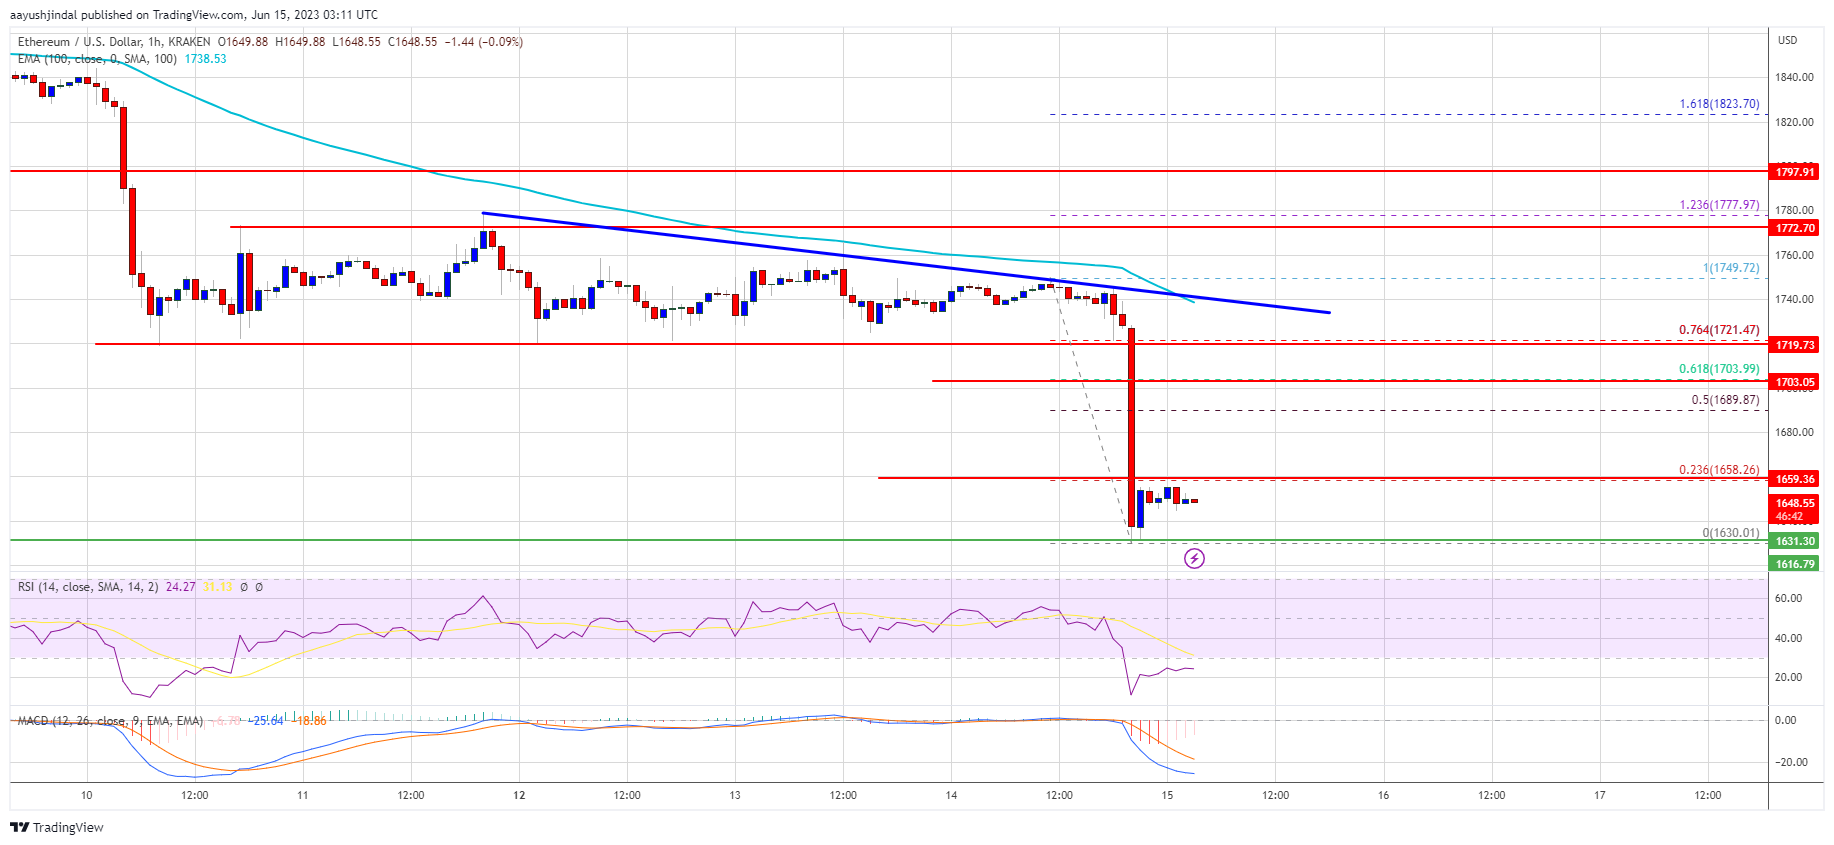
Source: ETHUSD on TradingView.com
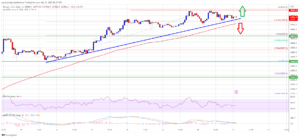
The next resistance sits near $1,740 and the trend line, above which Ethereum could rise toward the $1,780 level. Any more gains above the $1,780 resistance zone might send the price toward the $1,850 resistance.
More Losses in ETH?
If Ethereum fails to clear the $1,700 resistance, it could continue to move down. Initial support on the downside is near the $1,630 level and the recent low.
The next major support is near the $1,600 level. If there is a break and close below the $1,600 support, the price could accelerate lower toward the $1,550 support. Any more losses may perhaps send the price toward the $1,500 zone.
Technical Indicators
Hourly MACD – The MACD for ETH/USD is gaining momentum in the bearish zone.
Hourly RSI – The RSI for ETH/USD is now below the 50 level.
Major Support Level – $1,600
Major Resistance Level – $1,700
- SEO Powered Content & PR Distribution. Get Amplified Today.
- EVM Finance. Unified Interface for Decentralized Finance. Access Here.
- Quantum Media Group. IR/PR Amplified. Access Here.
- PlatoAiStream. Web3 Data Intelligence. Knowledge Amplified. Access Here.
- Source: https://www.newsbtc.com/analysis/eth/ethereum-price-resumes-downtrend-1500/
- :is
- 23
- 50
- 500
- a
- above
- accelerate
- After
- against
- aim
- also
- and
- any
- AS
- average
- bearish
- bearish signs
- Bears
- below
- Break
- Chart
- clear
- Close
- consolidating
- continue
- could
- data
- decision
- Dollar
- down
- downside
- Drop
- ETH
- ETH/USD
- ethereum
- Ethereum Price
- Failed
- fails
- Fed
- First
- For
- formed
- from
- Gain
- gaining
- Gains
- High
- HTTPS
- if
- immediate
- in
- initial
- interest
- INTEREST RATE
- IT
- Key
- Kraken
- Level
- levels
- Line
- losses
- Low
- lower
- MACD
- major
- max-width
- May..
- might
- Momentum
- more
- move
- moving
- moving average
- Near
- NewsBTC
- next
- now
- of
- on
- or
- over
- Pace
- pair
- perhaps
- plato
- Plato Data Intelligence
- PlatoData
- price
- proper
- Rate
- recent
- Recover
- recovery
- Resistance
- retracement
- Rise
- rsi
- send
- showing
- Signs
- similar
- Simple
- sits
- start
- steady
- Struggle
- support
- support level
- support levels
- Swing
- The
- the Fed
- There.
- to
- toward
- traded
- Trading
- TradingView
- Trend
- us
- US Dollar
- via
- was
- Wave
- which
- with
- zephyrnet