Published 23 hours ago
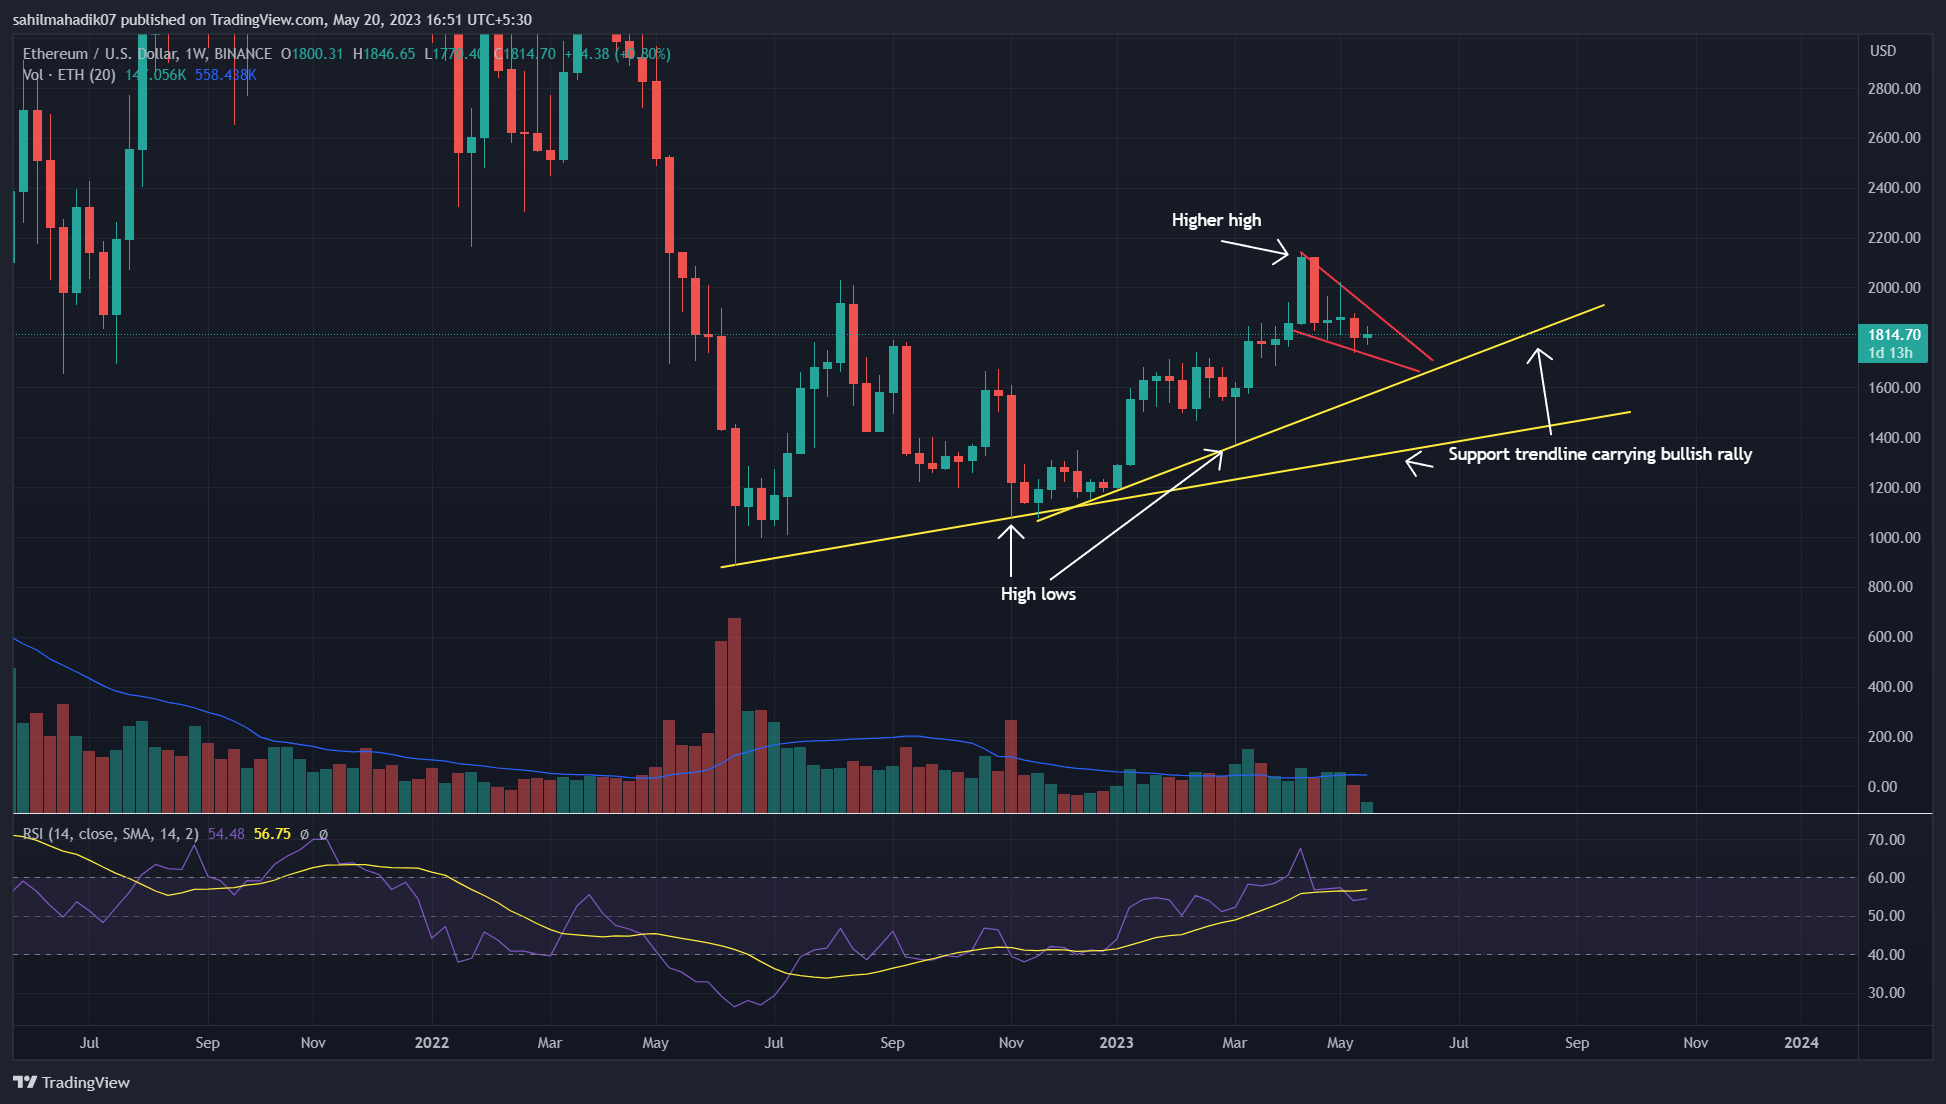
Ethereum Price Prediction: The Ethereum coin in the daily chart started showing signs of trend reversal during November-December 2022 with the formation of a new higher low in price. Moreover, the peak of April 2023 marked a higher high indicating a change in trend-defining dow theory. This formation of these higher peaks and troughs reflects an established bull trend which may gradually surge the ETH price high-up in the price chart.
advertisement
Key Points:
- Ethereum Fear and Greed Index at 48% project a bullish sentiment among traders.
- A bullish breakout from the wedge pattern could offer long entry opportunities to traders.
- The intraday trading volume in Ether is $4.15 Billion, indicating a 25% loss.
Source- Tradingview
Connecting the higher lows in the Ethereum price, the daily chart shows two rising trendlines(yellow). The coin price is obtaining strong support at this trendline offering potential buyers to accumulate at the dips.
Thus, until these two trendlines are intact, the ETH price would remain bullish in the long term.
Also Read: Top Web 3 Phones And Their Specifications
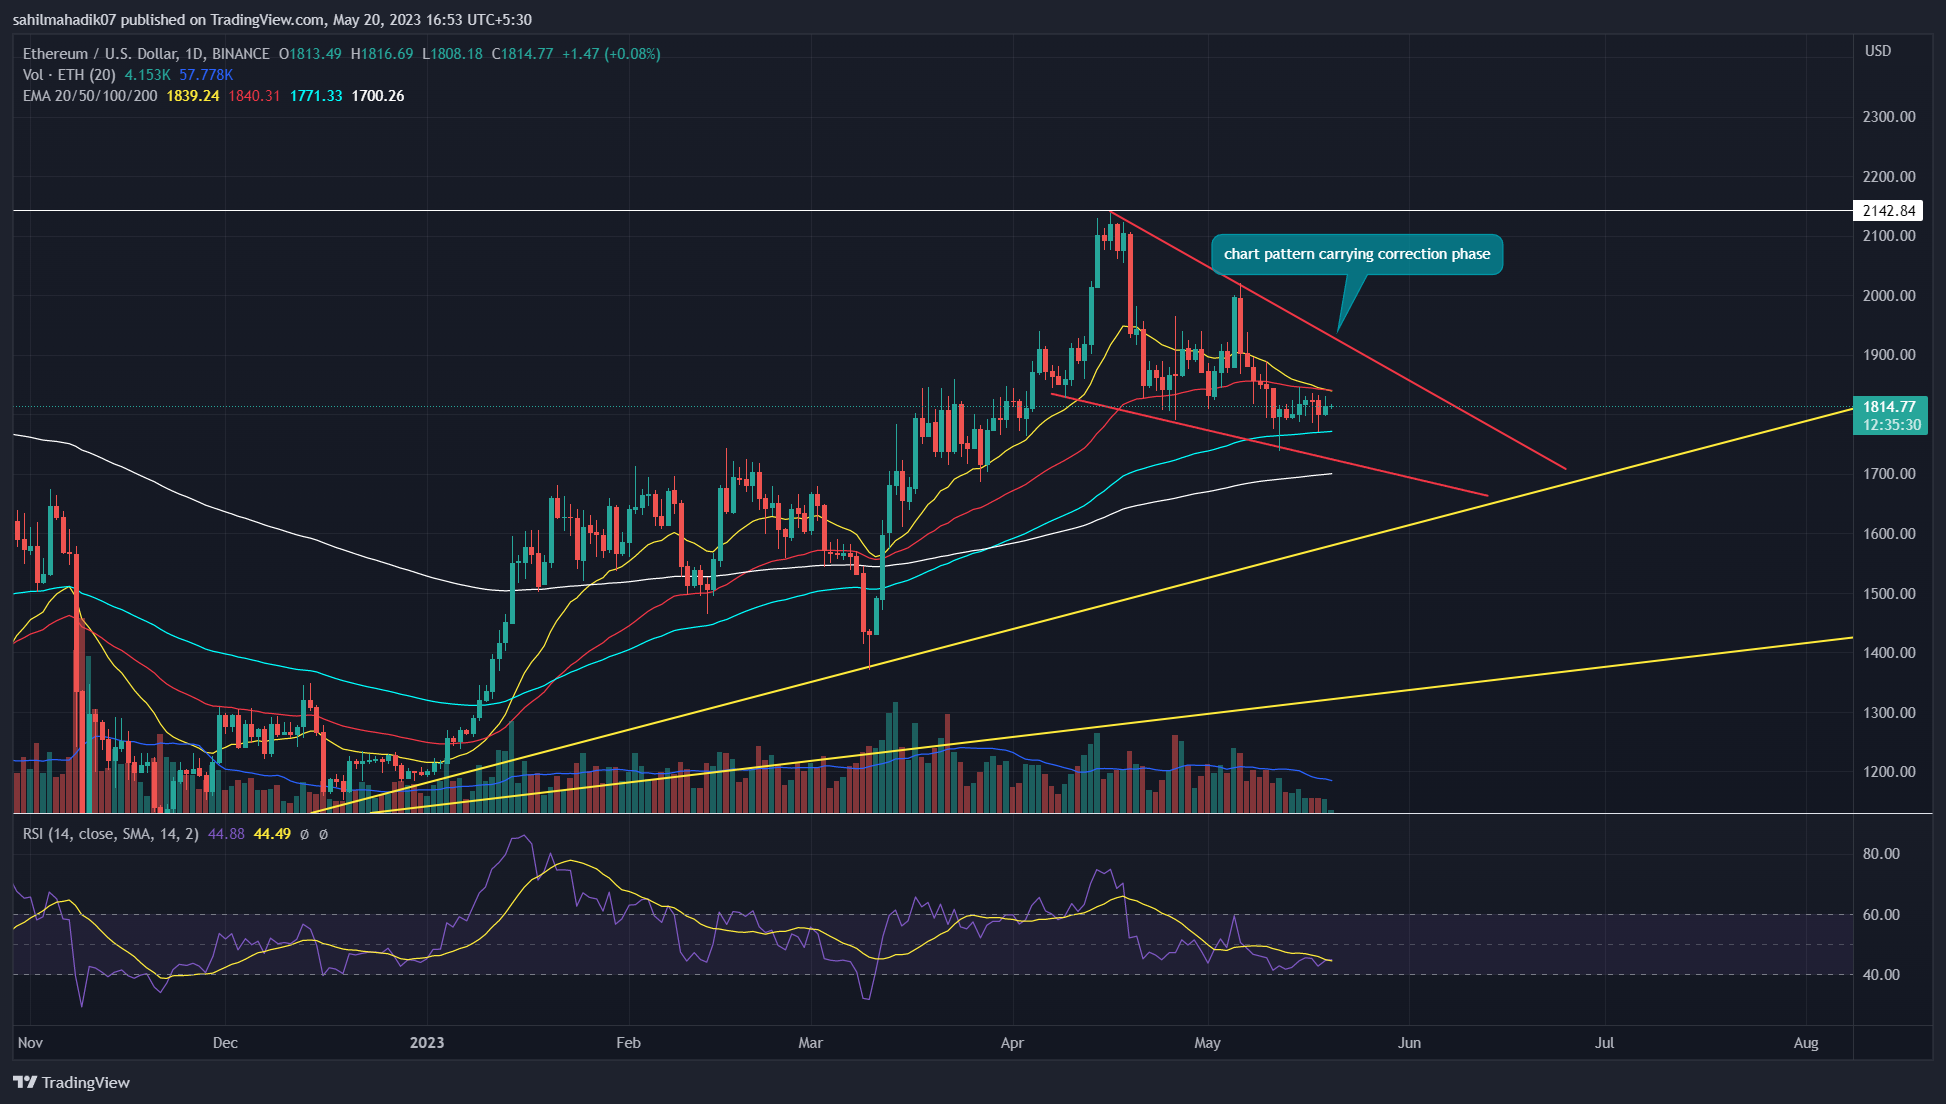
Chart Pattern May Kickstart New Recovery Cycle
Source- Tradingview
For over a month, the Ethereum price has been witnessing a correction phase under the influence of a wedge pattern. From the April 2023 peak of $2138, the prices tumbled 15% to reach the current price of $1813.
Concerning the longer bullish trend, this correction seems temporary which could offer trades another pullback opportunity to reaccumulate.
As of now, the Ethereum price trades at $1813 with an intraday of 0.01%. However, interested buyers must for a bullish breakout from the overhead trendline of the wedge pattern.
This breakout would recuperate the buying momentum and bolster buyers to surpass the $2138 swing high.
Technical Indicator
Exponential Moving Average: The ETH price moving above the 100-and-200-day EMAs project a bullish market sentiment.
Fibonacci Retracement Tool: The ongoing correction phase still above the 50% retracement level gives additional confirmation for buyers have an upper hand.
Ethereum Coin Price Intraday Levels-
- Spot rate: $1812
- Trend: Bearish
- Volatility: High
- Resistance level- $1830 and $1920
- Support level- $1700 and $1600
Share this article on:
advertisement
The presented content may include the personal opinion of the author and is subject to market condition. Do your market research before investing in cryptocurrencies. The author or the publication does not hold any responsibility for your personal financial loss.
- SEO Powered Content & PR Distribution. Get Amplified Today.
- PlatoAiStream. Web3 Data Intelligence. Knowledge Amplified. Access Here.
- Minting the Future w Adryenn Ashley. Access Here.
- Buy and Sell Shares in PRE-IPO Companies with PREIPO®. Access Here.
- Source: https://coingape.com/markets/ethereum-price-prediction-key-factors-that-sustain-long-term-bullish-trend-for-eth/
- :has
- :is
- :not
- 1
- 12
- 15%
- 200
- 2022
- 2023
- 23
- 7
- 8
- 9
- a
- above
- Accumulate
- Ad
- Additional
- ago
- am
- among
- an
- and
- Another
- any
- April
- ARE
- article
- At
- author
- avatar
- average
- Beauty
- been
- before
- Billion
- blockchain
- bolster
- breakout
- Brian
- bull
- Bullish
- buyers
- Buying
- change
- Chart
- Coin
- Coingape
- COM
- condition
- confirmation
- content
- correction phase
- could
- cryptocurrencies
- cryptocurrency
- Current
- daily
- different
- do
- does
- dow
- during
- Entertainment
- entry
- established
- ETH
- eth price
- Ether
- Ether (ETH)
- ethereum
- Ethereum Price
- Ethereum price prediction
- factors
- Fashion
- fear
- fear and greed index
- finance
- financial
- follow
- For
- formation
- from
- gives
- gradually
- Greed
- hand
- Have
- High
- higher
- hold
- HOURS
- However
- HTTPS
- i
- in
- include
- Including
- index
- indicating
- influence
- interested
- investing
- journalism
- jpg
- Key
- Last
- Long
- long-term
- longer
- loss
- Low
- Lows
- marked
- Market
- market research
- market sentiment
- May..
- Momentum
- Month
- Moreover
- moving
- moving average
- must
- New
- now
- obtaining
- of
- offer
- offering
- on
- ongoing
- Opinion
- opportunities
- Opportunity
- or
- out
- over
- past
- Pattern
- Peak
- personal
- phase
- phones
- plato
- Plato Data Intelligence
- PlatoData
- plugin
- points
- potential
- prediction
- presented
- price
- price chart
- Price Prediction
- Prices
- project
- Project A
- Publication
- pullback
- Rate
- reach
- Read
- recovery
- reflects
- remain
- research
- responsibility
- retracement
- Reversal
- rising
- seems
- sentiment
- Share
- Shows
- Signs
- started
- Still
- strong
- subject
- support
- surge
- surpass
- Swing
- temporary
- term
- that
- The
- their
- theory
- These
- this
- to
- tool
- Topics
- Traders
- trades
- Trading
- trading volume
- TradingView
- Trend
- two
- under
- until
- variety
- volume
- web
- Web 3
- which
- with
- witnessing
- working
- would
- written
- years
- Your
- zephyrnet