
Published 4 hours ago
Ethereum Price Prediction: In the daily time frame chart, the Ethereum price shows the formation of a head and shoulder pattern. This chart pattern is often spotted at the market top for trend reversal and offers an excellent short-selling opportunity upon the breakdown of its support trendline. Here’s how you may trade this pattern threatening the ETH price for longer correction.
advertisement
Key Points:
- With the increasing selling pressure, the Ethereum price forms a lower high at $1940, reflecting an early sign of trend reversal
- A breakdown below $1842 support will intensify the selling pressure and threaten the Ethereum price for a longer correction
- The intraday trading volume in Ether is $8.97 Billion, indicating a 97.5% gain.
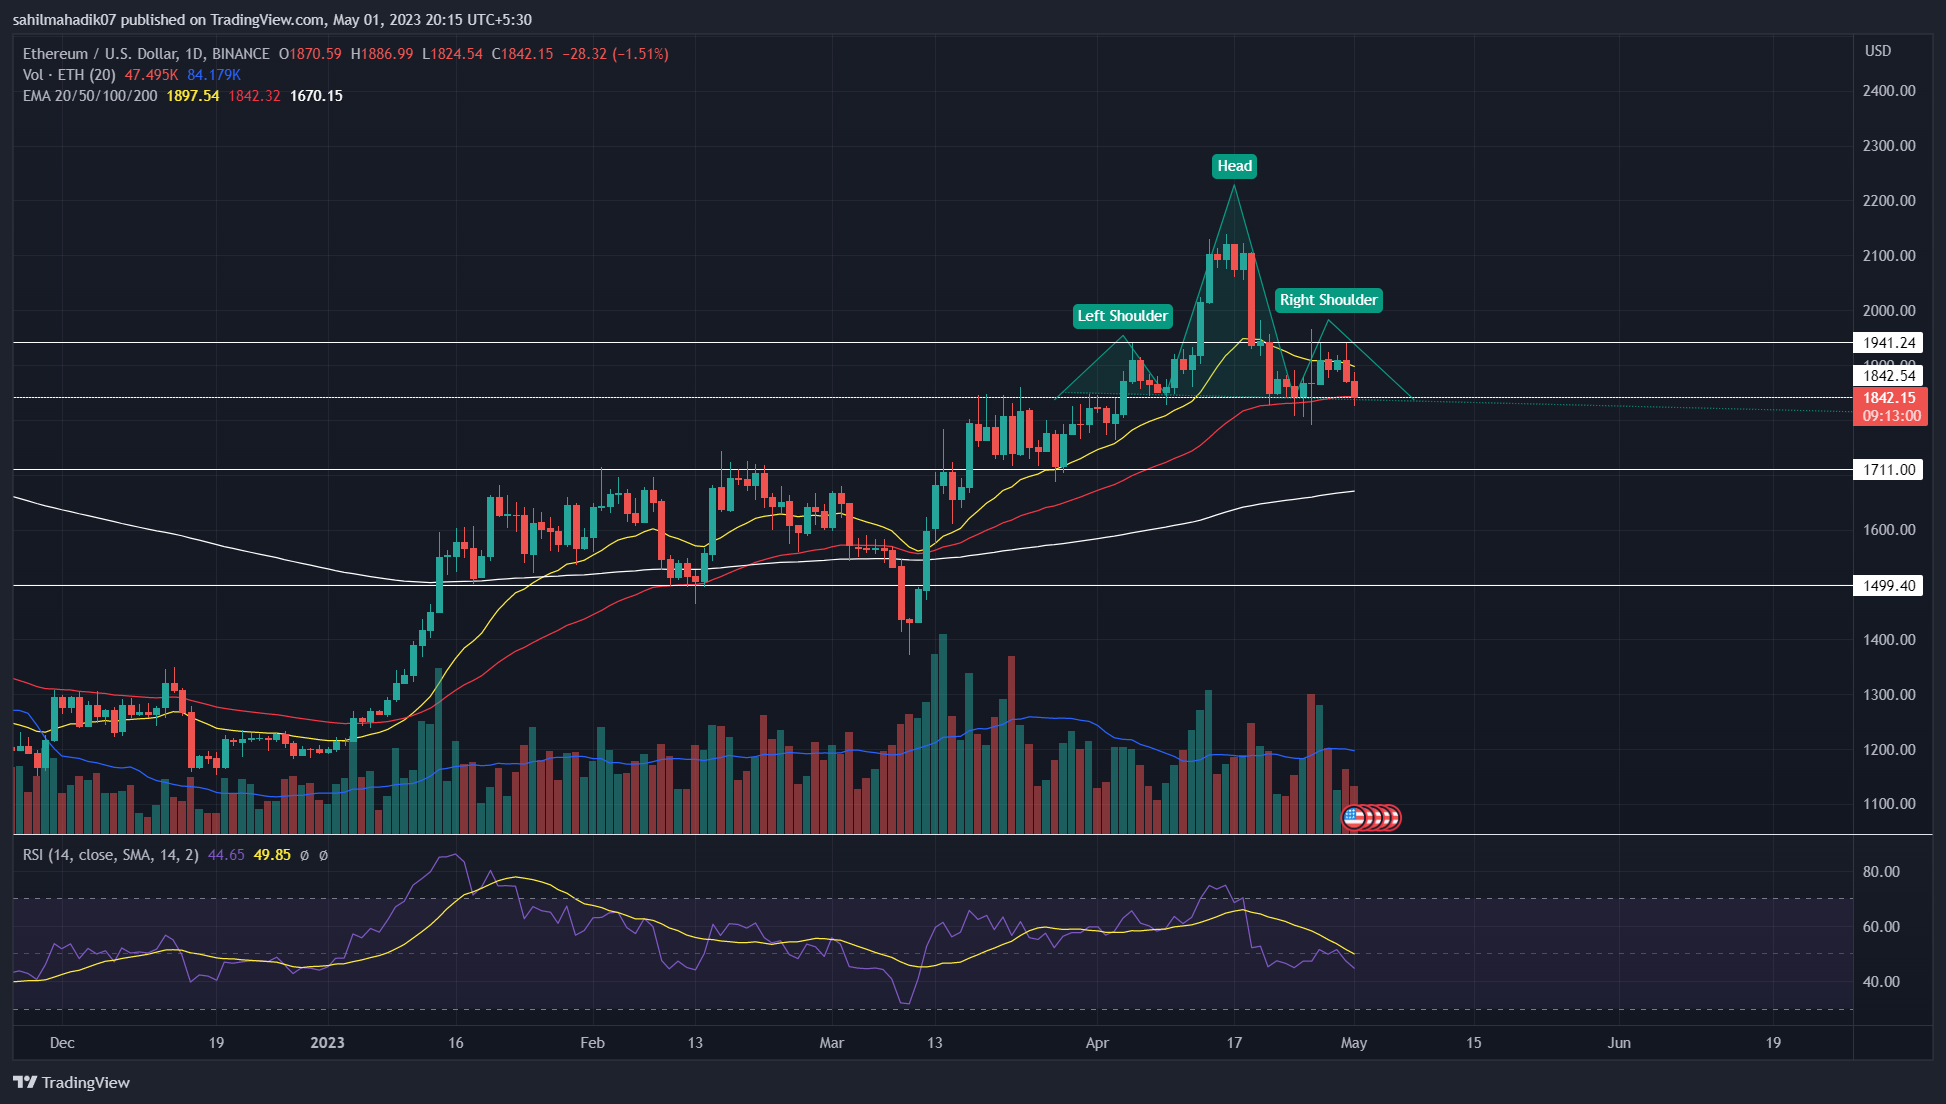
Source- Tradingview
Today, the Ethereum price witnessed an intraday loss of 1.5% and showed a breakdown attempt from the $1842 neckline support of the head and shoulder pattern. If the daily candle close below the aforementioned support, the sellers will gain an additional barrier to pressure down the coin buyers.
Interested sellers can look for entry opportunities below $1842 as the accelerated supply pressure may encourage the Ethereum price for longer correction. In ideal conditions, this pattern offers a sharp downfall of the same distance between the head and neckline measured from the breakdown point.
Trending Stories
Also Read: Bitcoin Declines Amid JPMorgan, PNC’s First Republic Bank Buyout Bid
Thus, with sustained selling, the ETH price may tumble 15% to hit the $1550-1500 mark.
On a contrary note, if the coin price manages to sustain above $1842, a breakout above the immediate resistance of $1940 will undermine the bearish thesis.
Technical Indicator
Relative Strength Index: A downtick in the daily RSI slope as it plunges below the midline reflects negative sentiment among market participants.
Exponential Moving Average: A potential breakdown below $1842 will also plunge below the 50-day EMA slope offering an extra edge to short sellers.
Ethereum Coin Price Intraday Levels-
- Spot rate: $1843
- Trend: Bearish
- Volatility: High
- Resistance level- $1940 and $2011
- Support level- $1840 and $1770
Share this article on:
advertisement
The presented content may include the personal opinion of the author and is subject to market condition. Do your market research before investing in cryptocurrencies. The author or the publication does not hold any responsibility for your personal financial loss.
- SEO Powered Content & PR Distribution. Get Amplified Today.
- PlatoAiStream. Web3 Data Intelligence. Knowledge Amplified. Access Here.
- Minting the Future w Adryenn Ashley. Access Here.
- Source: https://coingape.com/markets/ethereum-price-prediction-bearish-pattern-signals-eth-price-crash-to-1500-sell-or-hold/
- :is
- :not
- $1500
- 1
- 10
- 12
- 14
- 15%
- 20
- 28
- 7
- 8
- 9
- a
- above
- accelerated
- Ad
- Additional
- ago
- also
- am
- Amid
- among
- an
- and
- any
- article
- AS
- At
- author
- avatar
- average
- Bank
- banner
- barrier
- bearish
- Beauty
- before
- below
- between
- Billion
- blockchain
- Breakdown
- breakout
- Brian
- buyers
- Buyout
- CAN
- Chart
- Close
- Coin
- Coingape
- COM
- condition
- conditions
- content
- contrary
- Crash
- cryptocurrencies
- cryptocurrency
- daily
- Declines
- different
- distance
- do
- does
- down
- downfall
- Early
- Edge
- encourage
- Entertainment
- entry
- ETH
- eth price
- Ether
- Ether (ETH)
- ethereum
- Ethereum Price
- Ethereum price prediction
- excellent
- extra
- Fashion
- finance
- financial
- First
- follow
- For
- formation
- forms
- FRAME
- from
- Gain
- Have
- head
- High
- Hit
- hold
- HOURS
- How
- HTTPS
- i
- ideal
- if
- immediate
- in
- include
- Including
- increasing
- index
- indicating
- investing
- IT
- ITS
- journalism
- jpg
- JPMorgan
- Last
- longer
- Look
- loss
- manages
- mark
- Market
- market research
- May..
- moving
- moving average
- negative
- of
- offering
- Offers
- often
- on
- Opinion
- opportunities
- Opportunity
- or
- out
- participants
- past
- Pattern
- personal
- plato
- Plato Data Intelligence
- PlatoData
- plugin
- plunge
- plunges
- Point
- points
- potential
- prediction
- presented
- pressure
- price
- Price Crash
- Price Prediction
- Publication
- Rate
- reach
- Read
- reflects
- Republic
- research
- Resistance
- responsibility
- Reversal
- same
- sell
- Sellers
- Selling
- sentiment
- Share
- sharp
- Short
- Short-selling
- Shows
- sign
- signals
- Slope
- strength
- subject
- supply
- support
- The
- this
- threaten
- time
- to
- top
- Topics
- trade
- Trading
- trading volume
- TradingView
- Trend
- trending
- Undermine
- upon
- variety
- volume
- will
- with
- witnessed
- working
- written
- years
- you
- Your
- zephyrnet