Ethereum price extended its decline below the $1,850 level against the US Dollar. ETH could continue to move down if it stays below the $1,880 resistance.
- Ethereum remained in a bearish zone and traded below $1,850.
- The price is trading below $1,850 and the 100-hourly Simple Moving Average.
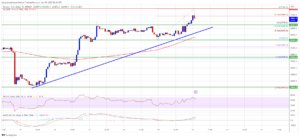
- There is a key bearish trend line forming with resistance near $1,835 on the hourly chart of ETH/USD (data feed via Kraken).
- The pair could continue to move down if it stays below $1,850 and $1,880.
Ethereum Price Extends Decline
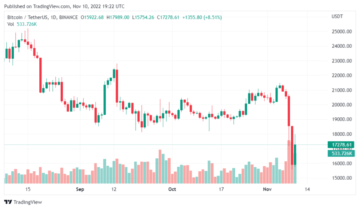
Ethereum’s price settled below the $1,880 pivot level to move into a bearish zone. ETH extended its decline and traded below the $1,850 support, similar to Bitcoin at $28,000.
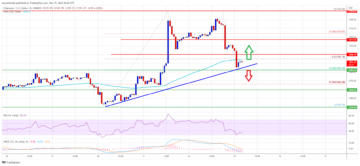
The price traded close to the $1,800 level. A low is formed near $1,805 and the price is consolidating losses. It is trading below $1,850 and the 100-hourly Simple Moving Average. There is also a key bearish trend line forming with resistance near $1,835 on the hourly chart of ETH/USD.
Immediate resistance is near the $1,835 level and the trend line. It is close to the 23.6% Fib retracement level of the downward move from the $1,940 swing high to the $1,805 low.
The next major resistance seems to be forming near $1,880 and the 100-hourly Simple Moving Average. The 50% Fib retracement level of the downward move from the $1,940 swing high to the $1,805 low is also near the $1,880 level.
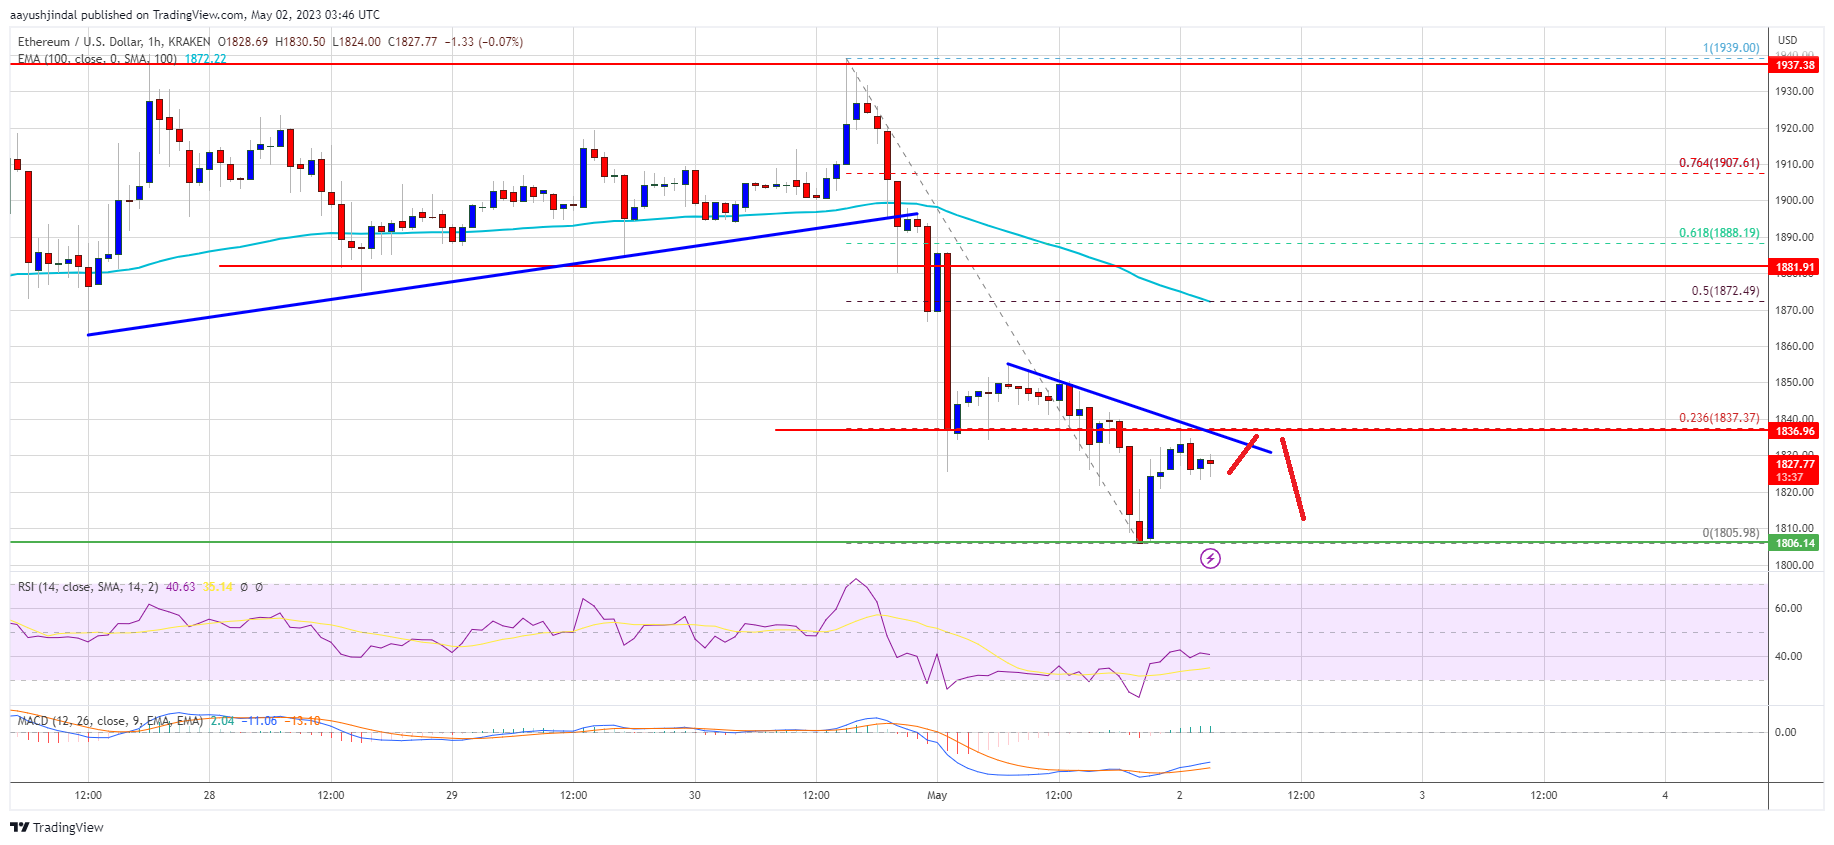
Source: ETHUSD on TradingView.com
A close above the $1,880 level might start a fresh increase. In the stated case, the price could rise toward the $1,920 resistance. Any more gains could send Ether toward the $1,940 resistance. The main hurdle is now forming near the $2,000 zone, above which the price could gain bullish momentum.
More Losses in ETH?
If Ethereum fails to clear the $1,835 resistance, it could continue to move down. Initial support on the downside is near the $1,800 level.
The next major support is near the $1,780 zone, below which ether price might drop toward the $1,740 support zone. Any more losses may perhaps take the price toward $1,700 in the near term.
Technical Indicators
Hourly MACD – The MACD for ETH/USD is now gaining momentum in the bearish zone.
Hourly RSI – The RSI for ETH/USD is below the 50 level.
Major Support Level – $1,800
Major Resistance Level – $1,880
- SEO Powered Content & PR Distribution. Get Amplified Today.
- PlatoAiStream. Web3 Data Intelligence. Knowledge Amplified. Access Here.
- Minting the Future w Adryenn Ashley. Access Here.
- Source: https://www.newsbtc.com/analysis/eth/ethereum-price-is-plunging-1800/
- :is
- 000
- 23
- 50
- a
- above
- against
- also
- and
- any
- At
- average
- BE
- bearish
- below
- Bullish
- but
- case
- Chart
- clear
- Close
- consolidating
- continue
- could
- data
- Decline
- Dollar
- down
- downside
- downward
- Drop
- Early
- ETH
- ETH/USD
- Ether
- Ether Price
- ethereum
- Ethereum Price
- fails
- For
- formed
- fresh
- fresh increase
- from
- Gain
- gaining
- Gains
- High
- HTTPS
- if
- in
- Increase
- initial
- into
- IT
- ITS
- Key
- Kraken
- Level
- Line
- losses
- Low
- MACD
- Main
- major
- max-width
- May..
- might
- Momentum
- more
- move
- moving
- moving average
- Near
- NewsBTC
- next
- now
- of
- on
- over
- perhaps
- Pivot
- plato
- Plato Data Intelligence
- PlatoData
- plunging
- price
- remained
- Resistance
- retracement
- Rise
- rsi
- say
- seems
- send
- Settled
- similar
- Simple
- start
- stated
- support
- support level
- Swing
- Take
- The
- There.
- to
- too
- toward
- traded
- Trading
- TradingView
- Trend
- uptrend
- us
- US Dollar
- via
- which
- with
- zephyrnet