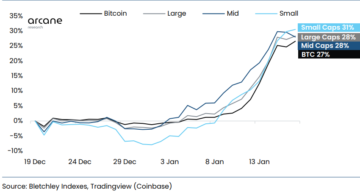
Ethereum price climbed higher above the $2,600 resistance. ETH outpaced Bitcoin and is holding gains above the $2,580 support zone.
- Ethereum extended its increase above the $2,650 resistance zone.
- The price is trading above $2,550 and the 100-hourly Simple Moving Average.
- There is a key bullish trend line forming with support at $2,590 on the hourly chart of ETH/USD (data feed via Kraken).
- The pair could start a downside correction if there is a move below the $2,580 support.
Ethereum Price Eyes More Upsides
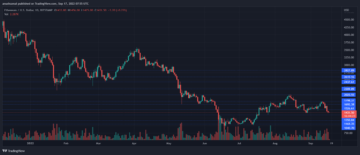
Ethereum price remained in a positive zone above the $2,500 resistance. ETH even outpaced BTC and climbed above the $2,650 resistance zone. A new multi-week high was formed near $2,683 before the price corrected gains.
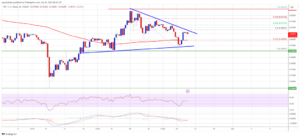
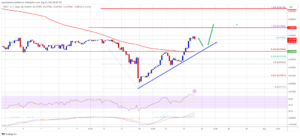
There was a move below the $2,620 and $2,600 levels. The price tested the 23.6% Fib retracement level of the upward move from the $2,245 swing low to the $2,683 high. There is also a key bullish trend line forming with support at $2,590 on the hourly chart of ETH/USD.
Ethereum is now trading above $2,550 and the 100-hourly Simple Moving Average. If there is a fresh increase, the price might face resistance near the $2,640 level. The next major resistance is now near $2,680. A clear move above the $2,680 level might send ETH toward $2,720. A close above the $2,720 resistance could push the price further into a bullish zone.

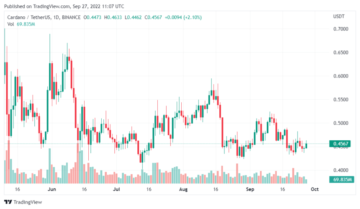
Source: ETHUSD on TradingView.com
The next key resistance is near $2,780. If the bulls push Ethereum above $2,780, there could be a rally toward $2,880. Any more gains might send the price toward the $3,000 zone.
Downside Correction in ETH?
If Ethereum fails to clear the $2,680 resistance, it could start a downside correction. Initial support on the downside is near the $2,590 level and the trend line.
The first key support could be the $2,465 zone or the 50% Fib retracement level of the upward move from the $2,245 swing low to the $2,683 high. A downside break below the $2,465 support might send the price further lower. In the stated case, Ether could test the $2,350 support. Any more losses might send the price toward the $2,220 level.
Technical Indicators
Hourly MACD – The MACD for ETH/USD is losing momentum in the bullish zone.
Hourly RSI – The RSI for ETH/USD is now above the 50 level.
Major Support Level – $2,465
Major Resistance Level – $2,680
Disclaimer: The article is provided for educational purposes only. It does not represent the opinions of NewsBTC on whether to buy, sell or hold any investments and naturally investing carries risks. You are advised to conduct your own research before making any investment decisions. Use information provided on this website entirely at your own risk.
- SEO Powered Content & PR Distribution. Get Amplified Today.
- PlatoData.Network Vertical Generative Ai. Empower Yourself. Access Here.
- PlatoAiStream. Web3 Intelligence. Knowledge Amplified. Access Here.
- PlatoESG. Carbon, CleanTech, Energy, Environment, Solar, Waste Management. Access Here.
- PlatoHealth. Biotech and Clinical Trials Intelligence. Access Here.
- Source: https://www.newsbtc.com/analysis/eth/ethereum-price-holds-ground-2580/
- :is
- :not
- $3
- 000
- 1
- 220
- 23
- 350
- 50
- 500
- 600
- a
- above
- advised
- also
- and
- any
- ARE
- article
- AS
- At
- average
- BE
- before
- below
- Bitcoin
- Break
- Bullish
- Bulls
- buy
- case
- Chart
- clear
- Climbed
- Close
- Conduct
- corrected
- could
- data
- decisions
- does
- downside
- educational
- entirely
- ETH
- eth outpaced
- ETH/USD
- Ether
- ethereum
- Ethereum Price
- Even
- extended
- Eyes
- Face
- fails
- First
- For
- formed
- fresh
- fresh increase
- from
- further
- Gains
- Ground
- High
- higher
- hold
- holding
- holds
- HTTPS
- if
- in
- Increase
- Indicators
- information
- initial
- into
- investing
- investment
- Investments
- IT
- ITS
- Key
- key resistance
- Kraken
- Level
- levels
- Line
- losing
- losses
- Low
- lower
- MACD
- major
- Making
- max-width
- might
- Momentum
- more
- move
- moving
- moving average
- Near
- New
- NewsBTC
- next
- now
- of
- on
- only
- Opinions
- or
- own
- pair
- plato
- Plato Data Intelligence
- PlatoData
- positive
- price
- provided
- purposes
- Push
- rally
- remained
- represent
- research
- Resistance
- retracement
- Risk
- risks
- rsi
- sell
- send
- Simple
- start
- stated
- suggest
- support
- support level
- Swing
- test
- tested
- The
- There.
- this
- to
- toward
- Trading
- TradingView
- Trend
- upward
- use
- via
- was
- Website
- whether
- with
- you
- Your
- zephyrnet