Ethereum price struggled to clear $1,660 and reacted to the downside against the US dollar. ETH remains at risk of more losses if it breaks the $1,550 support.
- Ethereum resumed its decline and retested the $1,550 support.
- The price is trading below $1,600 and the 100-hourly Simple Moving Average.
- There is a key bearish trend line forming with resistance near $1,610 on the hourly chart of ETH/USD (data feed via Kraken).
- The pair could accelerate lower if there is a close below the $1,550 support zone.
Ethereum Price Dives Again
Ethereum failed to settle above the $1,665 resistance zone. ETH started a fresh decline from the $1,665 resistance zone and dived below the $1,650 level.
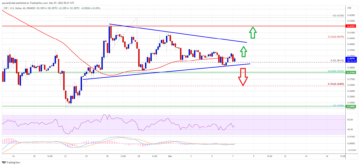
The bears pushed the price below the $1,600 level and the 100-hourly Simple Moving Average. Ether retested the $1,550 support. A low was formed near $1,549 and the price is now attempting a recovery wave. There was a move above the 23.6% Fib retracement level of the recent decline from the $1,664 swing high to the $1,549 low.
Ethereum is now trading below $1,600 and the 100-hourly Simple Moving Average. There is also a key bearish trend line forming with resistance near $1,610 on the hourly chart of ETH/USD.
On the upside, the price might face resistance near the $1,600 level. The first major resistance is near the trend line and $1,610. It is close to the 50% Fib retracement level of the recent decline from the $1,664 swing high to the $1,549 low.

Source: ETHUSD on TradingView.com
The next major resistance is $1,620 or the 100-hourly Simple Moving Average, above which the price could rise toward the $1,665 resistance zone. A close above the $1,665 resistance might send the price toward the key resistance at $1,750. The next key resistance might be $1,820. Any more gains might open the doors for a move toward $1,880.
Downside Break in ETH?
If Ethereum fails to clear the $1,600 resistance, it could continue to move down. Initial support on the downside is near the $1,565 level. The next key support is $1,550.
A downside break below the $1,550 support might start another strong decline. In the stated case, the price could revisit the $1,465 level. Any more losses may perhaps send Ether toward the $1,420 level.
Technical Indicators
Hourly MACD – The MACD for ETH/USD is losing momentum in the bearish zone.
Hourly RSI – The RSI for ETH/USD is now below the 50 level.
Major Support Level – $1,550
Major Resistance Level – $1,620
- SEO Powered Content & PR Distribution. Get Amplified Today.
- PlatoData.Network Vertical Generative Ai. Empower Yourself. Access Here.
- PlatoAiStream. Web3 Intelligence. Knowledge Amplified. Access Here.
- PlatoESG. Carbon, CleanTech, Energy, Environment, Solar, Waste Management. Access Here.
- PlatoHealth. Biotech and Clinical Trials Intelligence. Access Here.
- Source: https://www.newsbtc.com/analysis/eth/ethereum-price-grinds-lower-1500/
- :is
- 1
- 23
- 420
- 50
- 500
- 610
- 820
- a
- above
- accelerate
- against
- also
- and
- Another
- any
- At
- attempting
- average
- BE
- bearish
- Bears
- below
- Break
- breaks
- case
- Chart
- clear
- Close
- continue
- could
- data
- Decline
- Dollar
- doors
- down
- downside
- Drop
- ETH
- ETH/USD
- Ether
- ethereum
- Ethereum Price
- Face
- Failed
- fails
- First
- For
- formed
- fresh
- from
- Gains
- High
- HTTPS
- if
- in
- initial
- IT
- ITS
- Key
- key resistance
- Kraken
- Level
- Line
- losing
- losses
- Low
- lower
- MACD
- major
- max-width
- May..
- might
- Momentum
- more
- move
- moving
- moving average
- Near
- NewsBTC
- next
- now
- of
- on
- open
- or
- pair
- perhaps
- plato
- Plato Data Intelligence
- PlatoData
- price
- pushed
- recent
- recovery
- remains
- Resistance
- retracement
- Rise
- Risk
- rsi
- s
- send
- settle
- Simple
- start
- started
- stated
- strong
- support
- support level
- Swing
- The
- There.
- to
- toward
- Trading
- TradingView
- Trend
- Upside
- us
- US Dollar
- via
- Vulnerable
- was
- Wave
- which
- with
- zephyrnet