Published 45 mins ago
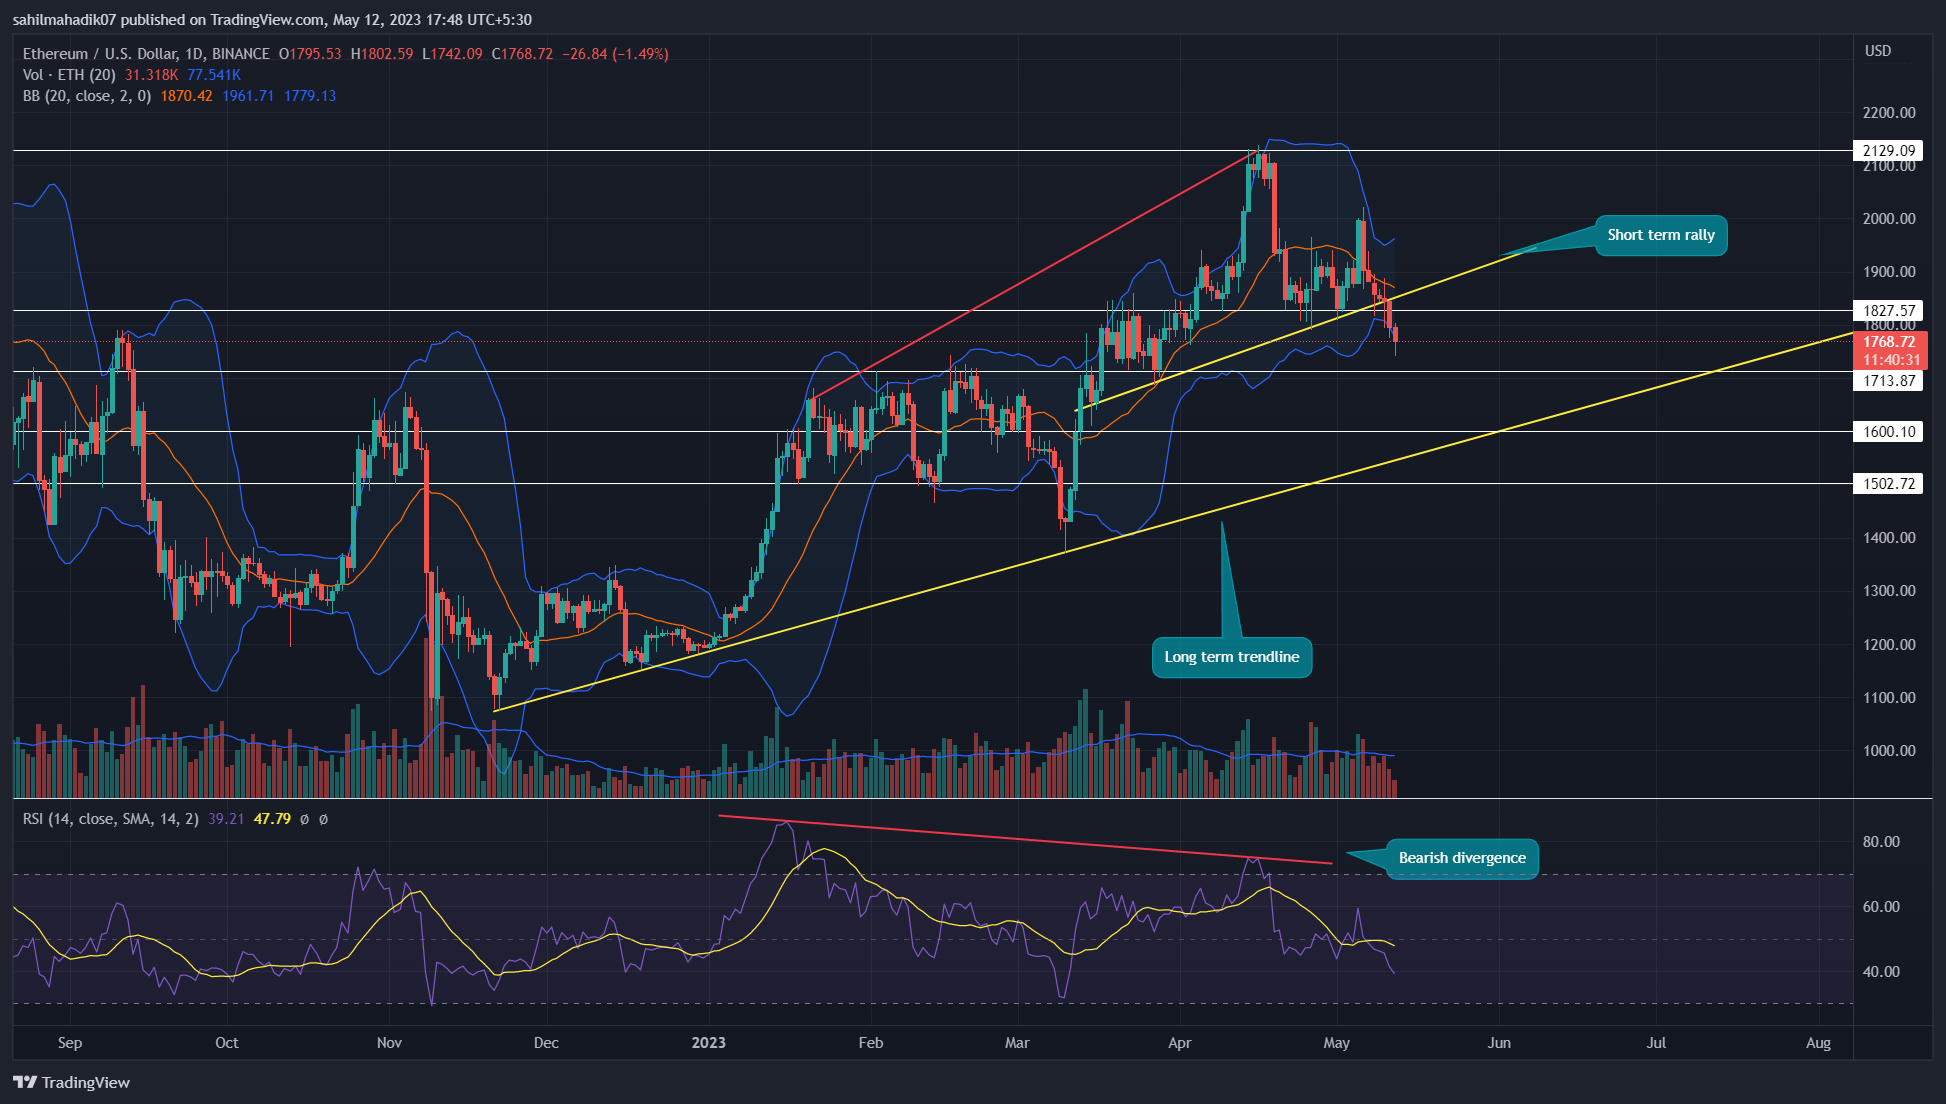
Ethereum Price Analysis: On May 11th, the ETH coin price gave a decisive breakdown from the combined support levels of $1827, a 23.6% Fibonacci retracement level, and a rising support trendline. This breakdown accelerates the selling momentum in the market and has set the ETH price for a longer downfall. However, in the big picture, this ongoing correction is likely a temporary pullback and the overall trend remains bullish.
advertisement
Key Points:
- The Ethereum price falling for seven consecutive days reflects the aggressive selling momentum in the market
- The ETH price correction still above the 50% Fibonacci retracement level indicates the market trend is bullish
- The intraday trading volume in Ether is $9.5 Billion, indicating a 7.5% loss.
Source- Tradingview
By the press time, the Ethereum price trades at the $1766 mark, with an intraday loss of 1.61%. Though this red candle gives a suitable follow-up confirmation for support trendline breakdown mentioned above, the lower price rejection attached to the daily candle reflects the buyers trying to wrestle trend control.
This rejection may retest the breach level as a potential retest to check price sustainability at a lower chart level. If the selling pressure persists, the Ethereum price is likely to tumble 15% to hit the $1500 psychological support.
Trending Stories
Also Read: Best Cryptos Private Sale For 2023
However, Ethereum’s price in the daily chart shows a long-coming support trendline reflecting the overall bullish trend. The coin price has rebounded from this support trendline thrice indicating the traders are actively accumulating at the market dip.
Thus, a possible retest to the trendline could offer buyers an excellent opportunity to take pullback trades. Until this dynamic support is intact, the Ethereum price may remain in a bullish trend.
Technical Indicator
Relative Strength Index: The daily RSI slope shows the bearish divergence between the peak of mid-January and mid-April reflecting weakness in bullish momentum. Thus, the potential buyers wait for a significant reversal sign at the support trendline before entering.
Bollinger Band: the ETH price falling along with the lower band on the Bollinger Band indicator accentuates momentum selling in the market.
Ethereum Coin Price Intraday Levels-
- Spot rate: $1767
- Trend: Bearish
- Volatility: Medium
- Resistance level- $1830 and $1920
- Support level- $1700 and $1600
Share this article on:
advertisement
The presented content may include the personal opinion of the author and is subject to market condition. Do your market research before investing in cryptocurrencies. The author or the publication does not hold any responsibility for your personal financial loss.
<!– Close Story–>
- SEO Powered Content & PR Distribution. Get Amplified Today.
- PlatoAiStream. Web3 Data Intelligence. Knowledge Amplified. Access Here.
- Minting the Future w Adryenn Ashley. Access Here.
- Buy and Sell Shares in PRE-IPO Companies with PREIPO®. Access Here.
- Source: https://coingape.com/markets/ethereum-price-analysis-these-key-support-drive-bullish-outlook-for-eth-price/
- :has
- :is
- :not
- $1500
- 1
- 10
- 12
- 14
- 15%
- 20
- 200
- 23
- 7
- 8
- 9
- a
- above
- accelerates
- actively
- Ad
- aggressive
- ago
- along
- am
- an
- analysis
- and
- any
- ARE
- article
- AS
- At
- author
- avatar
- BAND
- bearish
- bearish divergence
- Beauty
- before
- between
- Big
- Big Picture
- Billion
- blockchain
- breach
- Breakdown
- Brian
- Bullish
- buyers
- Chart
- check
- Coin
- Coingape
- COM
- combined
- condition
- confirmation
- consecutive
- content
- control
- could
- crypto
- Crypto News
- cryptocurrencies
- cryptocurrency
- cryptos
- daily
- Days
- decisive
- different
- Dip
- Divergence
- do
- does
- downfall
- drive
- dynamic
- entering
- Entertainment
- ETH
- eth price
- Ether
- Ether (ETH)
- ethereum
- Ethereum Price
- Ethereum Price Analysis
- Ethereum's
- excellent
- Falling
- Fashion
- Fibonacci
- finance
- financial
- follow
- For
- from
- gives
- Have
- Hit
- hold
- However
- HTTPS
- i
- if
- in
- include
- Including
- index
- indicates
- indicating
- investing
- journalism
- jpg
- Key
- Last
- Level
- levels
- likely
- long-term
- longer
- loss
- mark
- Market
- market research
- May..
- mentioned
- Momentum
- news
- of
- offer
- on
- ongoing
- Opinion
- Opportunity
- or
- out
- Outlook
- overall
- past
- Peak
- persists
- personal
- picture
- plato
- Plato Data Intelligence
- PlatoData
- plugin
- points
- possible
- potential
- presented
- press
- pressure
- price
- Price Analysis
- private
- Publication
- pullback
- Rate
- reach
- Read
- Red
- reflects
- remain
- remains
- research
- responsibility
- retracement
- Reversal
- rising
- sale
- Selling
- set
- seven
- Share
- Shows
- sign
- significant
- Still
- strength
- subject
- suitable
- support
- support levels
- Sustainability
- Take
- temporary
- The
- These
- this
- though?
- time
- to
- Topics
- Traders
- trades
- Trading
- trading volume
- TradingView
- Trend
- trending
- until
- variety
- volume
- wait
- weakness
- with
- working
- written
- years
- Your
- zephyrnet