- Ethereum price is gaining bearish momentum below the $1,900 resistance against the US Dollar.
- ETH price is now trading below $1,920 and the 55 simple moving average (4 hours).
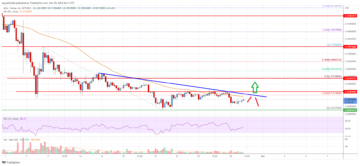
- There is a key bearish trend line forming with resistance near $1,910 on the 4-hour chart (data feed from Coinbase).
- The pair could recover, but it is likely to face sellers near the $1,920 resistance zone.
Ethereum price is declining below $1,920 against the US Dollar. ETH/USD remains at a risk of more downsides below the $1,800 support zone.
Ethereum Price Analysis
This past week, Ethereum struggled to clear the $1,950 resistance zone against the US Dollar. ETH price attempted a few times to clear the $1,950 level but failed.
The recent high was formed near $1,939 and the price started a fresh decline. There was a drop below the $1,900 and $1,880 support levels. The pair even spiked below the $1,820 support. A low is formed near $1,805 and the price is now consolidating losses.
It is now trading below $1,880 and the 55 simple moving average (4 hours). The price is now facing resistance near the $1,870 level. It is near the 50% Fib retracement level of the recent decline from the $1,939 swing high to the $1,805 low.
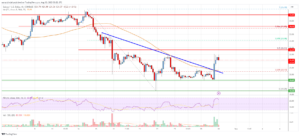
The next major resistance is near the $1,900 level. There is also a key bearish trend line forming with resistance near $1,910 on the 4-hour chart. The trend line is near the 76.4% Fib retracement level of the recent decline from the $1,939 swing high to the $1,805 low.
The next major resistance is near the $1,940 zone. A clear move above the $1,910 and $1,940 resistance levels might call for a fresh move to $2,000. Any more gains could even send the price toward the $2,100 resistance zone or even $2,140 in the near term.
On the downside, initial support is near the $1,820 level. The next major support is now near the $1,800 level. A break below the $1,800 support could push the price to $1,720. If the bulls fail to protect the $1,720 support, the price might decline toward $1,650.

Ethereum Price
Looking at the chart, Ethereum price is trading below $1,880 and the 55 simple moving average (4 hours). Overall, Ether’s price could recover, but it is likely to face sellers near the $1,920 resistance zone.
Technical indicators
4 hours MACD – The MACD for ETH/USD is now gaining momentum in the bearish zone.
4 hours RSI (Relative Strength Index) – The RSI for ETH/USD is now below the 50 level.
Key Support Levels – $1,820, followed by the $1,800 zone.
Key Resistance$ Levels – $1,870 and $1,900.
- SEO Powered Content & PR Distribution. Get Amplified Today.
- PlatoAiStream. Web3 Data Intelligence. Knowledge Amplified. Access Here.
- Minting the Future w Adryenn Ashley. Access Here.
- Source: https://www.livebitcoinnews.com/ethereum-price-analysis-eth-faces-increase-in-bearish-pressure/
- :is
- 000
- 100
- 50
- a
- above
- against
- also
- analysis
- and
- any
- At
- attempted
- average
- bearish
- Bearish Momentum
- below
- Break
- Bulls
- but
- by
- call
- Chart
- clear
- coinbase
- comments
- consolidating
- could
- data
- Decline
- Declining
- Dollar
- downside
- downsides
- Drop
- end
- ETH
- eth price
- ETH/USD
- ethereum
- Ethereum Price
- Ethereum Price Analysis
- Even
- Face
- faces
- facing
- FAIL
- Failed
- few
- follow
- followed
- For
- formed
- fresh
- from
- gaining
- Gains
- High
- HOURS
- HTTPS
- if
- in
- Increase
- index
- initial
- internal
- IT
- Key
- Level
- levels
- likely
- Line
- losses
- Low
- MACD
- major
- might
- Momentum
- more
- move
- moving
- moving average
- Near
- next
- now
- of
- on
- or
- overall
- past
- plato
- Plato Data Intelligence
- PlatoData
- Post
- pressure
- price
- Price Analysis
- protect
- Push
- recent
- Recover
- relative strength index
- remains
- Resistance
- retracement
- Risk
- rsi
- Sellers
- send
- Simple
- started
- strength
- support
- support levels
- Swing
- TAG
- The
- There.
- times
- to
- toward
- Trading
- TradingView
- Trend
- us
- US Dollar
- was
- week
- with
- zephyrnet