- Ethereum price is correcting gains below the $1,650 level against the US Dollar.
- ETH price is now trading near $1,630 and the 55 simple moving average (4-hours).
- There is a key contacting triangle forming with support near $1,610 on the 4-hours chart (data feed from Coinbase).
- The pair could climb further if it stays above the $1,600 support zone.
Ethereum price is consolidating above the $1,600 level against the US Dollar. ETH/USD could rise further if it clears the $1,660 resistance zone.
Ethereum Price Analysis
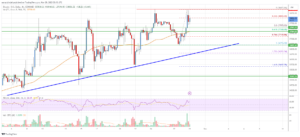
In the past few days, ethereum saw a decent increase above the $1,600 level against the US Dollar. ETH price was able to gain pace for a move above the $1,620 level and the 55 simple moving average (4-hours).
The bulls even cleared the $1,680 resistance zone. However, the bears were active near the $1,715 and $1,720 levels. A high was formed near $1,714 and the price saw a downside correction. There was a move below the $1,680 and $1,650 levels.
There was a move below the 50% Fib retracement level of the upward move from the $1,534 swing low to $1,714 high. The price is now trading near $1,630 and the 55 simple moving average (4-hours).
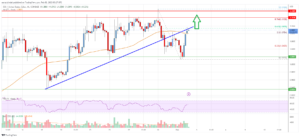
There is also a key contacting triangle forming with support near $1,610 on the 4-hours chart. An immediate resistance on the upside is near the $1,640 level. The next major resistance is near the $1,660 zone and the triangle upper trend line.
A clear move above the $1,660 level could send the price towards $1,720. Any more gains could even send the price towards the $1,800 resistance zone in the near term.
On the downside, an initial support is near the $1,610 level and the triangle trend line. The next major support is now near the $1,600 level or the 61.8% Fib retracement level of the upward move from the $1,534 swing low to $1,714 high.
A break below the $1,600 support could push the price to $1,500. Any more losses could lead the price towards $1,440 or even $1,320 in the coming days.

Ethereum Price
Looking at the chart, Ethereum price is clearly trading near the $1,630 zone and the 55 simple moving average (4-hours). Overall, ether price could climb further if it stays above the $1,600 support zone.
Technical indicators
4 hours MACD – The MACD for ETH/USD is now losing momentum in the bullish zone.
4 hours RSI (Relative Strength Index) – The RSI for ETH/USD is now below the 50 level.
Key Support Levels – $1,600, followed by the $1,500 zone.
Key Resistance$ Levels – $1,660 and $1,700.
- SEO Powered Content & PR Distribution. Get Amplified Today.
- Platoblockchain. Web3 Metaverse Intelligence. Knowledge Amplified. Access Here.
- Source: https://www.livebitcoinnews.com/ethereum-price-analysis-dips-remain-attractive-near-1550/
- a
- Able
- above
- active
- against
- analysis
- and
- attractive
- average
- Bears
- below
- Break
- Bullish
- Bulls
- Chart
- clear
- clearly
- climb
- coinbase
- coming
- comments
- consolidating
- could
- data
- Days
- Dollar
- downside
- ETH
- eth price
- ETH/USD
- Ether
- Ether Price
- ethereum
- Ethereum Price
- Ethereum Price Analysis
- Even
- few
- follow
- followed
- formed
- from
- further
- Gain
- Gains
- High
- HOURS
- However
- HTTPS
- immediate
- in
- index
- initial
- internal
- IT
- Key
- lead
- Level
- levels
- Line
- losing
- losses
- Low
- MACD
- major
- Momentum
- more
- move
- moving
- moving average
- Near
- next
- overall
- Pace
- past
- plato
- Plato Data Intelligence
- PlatoData
- Post
- price
- Price Analysis
- Push
- relative strength index
- remain
- Resistance
- retracement
- Rise
- rsi
- Simple
- strength
- support
- support levels
- TAG
- The
- to
- towards
- Trading
- TradingView
- Trend
- Upside
- upward
- us
- US Dollar
- zephyrnet