SNEAK PEEK:
- According to recent research, bulls are in charge of the ETH market.
- If the positive trend continues, bulls must break the $1,716.49 resistance.
- Long-term indicators point to a positive outlook.
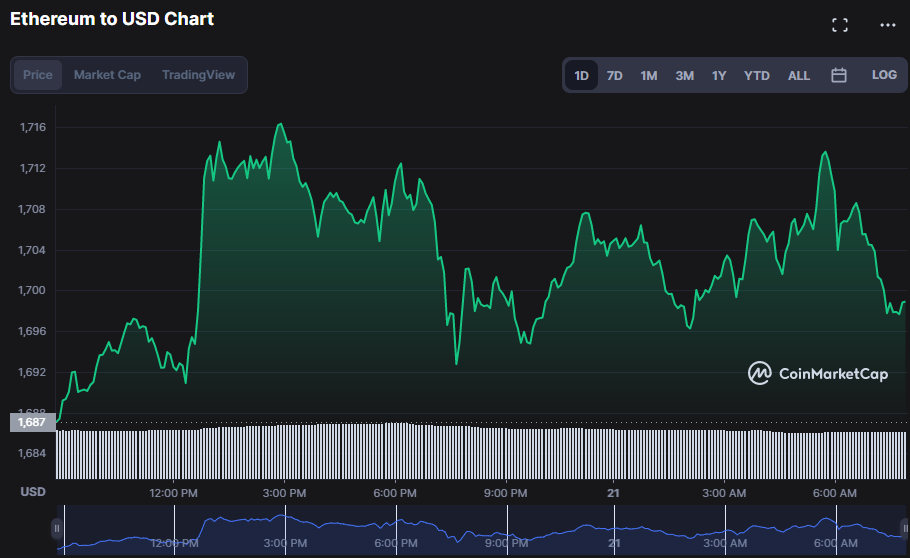
Throughout the last day, Ethereum (ETH) buyers have been in charge, driving the price between a high of $1,716.49 and a low of $1,686.70. At the time of writing, bullish optimism had triumphed, and ETH had risen 0.70% to $1,699.43.
Market capitalization increased by 0.66%, to $207,966,291,753, as traders rushed into the market in anticipation of continuing the price boom and subsequent profit opportunities. However, the positive momentum may only be maintained briefly, as 24-hour trade volume decreased by 3.70% to $7,385,979,119.
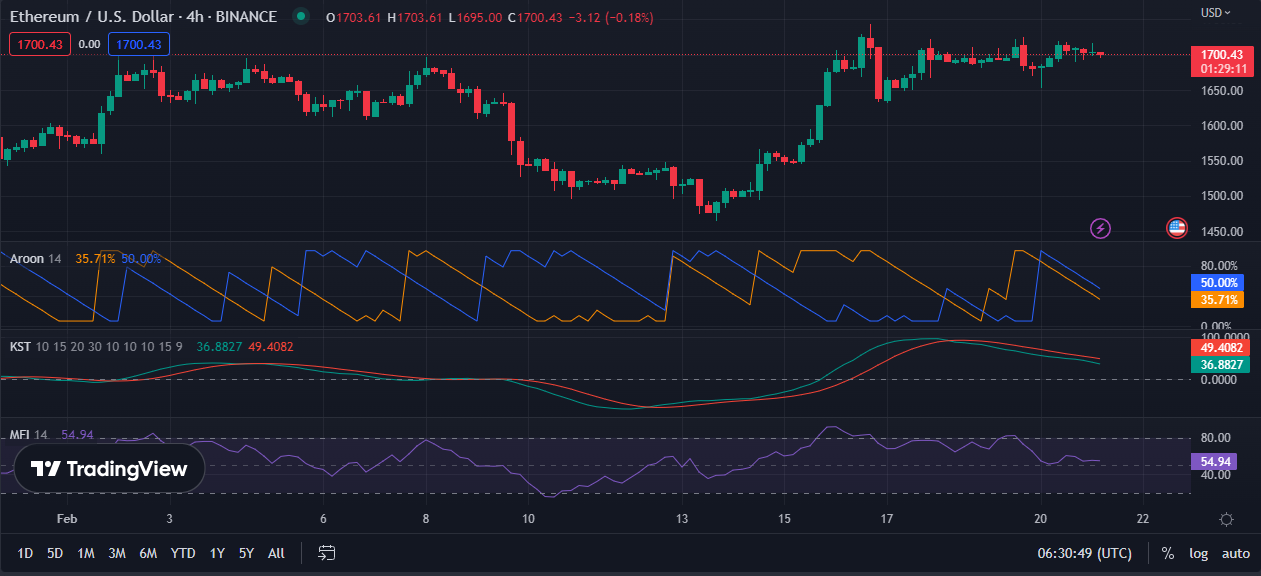
The Aroon up reading of 35.71% crosses below the Aroon down reading of 50.00%, indicating that the bullish momentum in ETH is fading and that a probable negative trend looms. This shift means that traders should be on the lookout for any possible short-term drops in ETH prices and prepare to respond fast if necessary. When this occurs, traders should respond by closing long positions and considering taking short ones instead.
With a value of 38.7860, the Know Sure Thing (KST) indicator is trending below the signal line, reinforcing the negative perspective as it indicates declining bullish momentum. This movement suggests that buying pressure is starting to wane and that the bears are preparing to take over, so traders should be cautious about opening long positions.
The Money Flow Index (MFI) reading of 54.98 suggests that the market is still in excellent health since values over 80 indicate overbought markets, while readings below 20 indicate an oversold market. This level implies that traders should be careful while aware of the opportunities that might arise from placing short positions in this market.
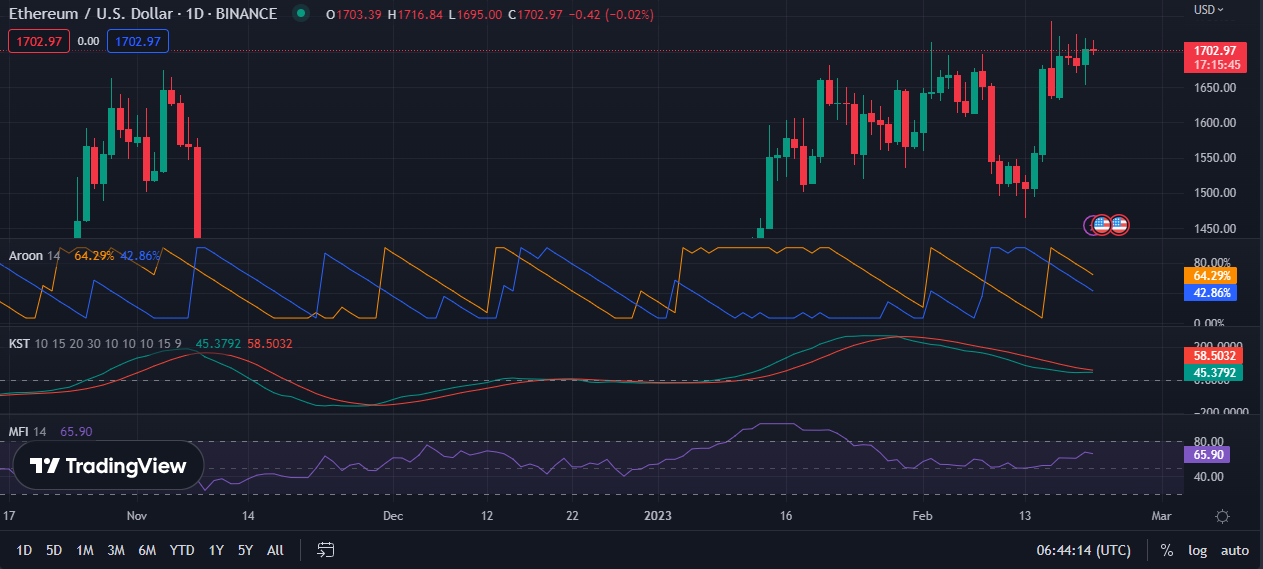
In the 24-hour price chart, however, the Aroon up reading of 64.29% trends above the Aroon down reading of 42.86%, indicating that, although the short-term is gloomy, there is a substantial likelihood of an uptrend in the medium term. This trend suggests that purchasing activity is heating up as investors anticipate future gains and attempt to profit from them.
The KST continues to trend below its signal line with a reading of 45.3011, indicating that bears still have a chance to impact the market as buyers look to purchase bargains in expectation of future gains.
This level implies that, although the short-term trend may stay gloomy, there is still a substantial possibility of a medium-term upturn.
While the MFI is at 65.88, prices are still in the “neutral zone,” meaning that buyers and sellers have nearly equal influence and that prices may soon rise as buyers attempt to capitalize on any negative trend in the market. With a sustained negative trend, investors must be careful in their purchasing activity and may profit from waiting for a break in the signal line before joining the market.
Technical indicators suggest a positive long-term picture for the ETH market, even if bears may dominate in the short term.
Disclaimer: In good faith, we disclose our thoughts and opinions in our price analysis, as well as all the facts we give. Each reader is responsible for his or her own investigation. Reader discretion is advised before taking any action.
- SEO Powered Content & PR Distribution. Get Amplified Today.
- Platoblockchain. Web3 Metaverse Intelligence. Knowledge Amplified. Access Here.
- Source: https://investorbites.com/ethereum-price-analysis-21-2/
- 70
- 98
- a
- About
- above
- Action
- activity
- All
- Although
- analysis
- and
- anticipate
- anticipation
- Bears
- before
- below
- between
- boom
- Break
- briefly
- Bullish
- Bulls
- buyers
- Buying
- capitalization
- capitalize
- careful
- cautious
- Chance
- charge
- Chart
- closing
- CoinMarketCap
- considering
- continues
- continuing
- day
- Declining
- Disclose
- discretion
- discussion
- dominate
- down
- driving
- Drops
- each
- ETH
- eth bulls
- eth market
- ETH/USD
- ethereum
- Ethereum News
- Ethereum Price
- Ethereum Price Analysis
- Even
- excellent
- expectation
- extensive
- FAST
- flow
- from
- future
- Gains
- Give
- good
- Health
- High
- However
- HTTPS
- Impact
- in
- increased
- index
- indicate
- indicates
- indicating
- Indicator
- Indicators
- influence
- instead
- internal
- investigation
- Investors
- IT
- joining
- Know
- Last
- Level
- Line
- Long
- long-term
- Look
- Low
- Market
- Market News
- Markets
- meaning
- means
- medium
- might
- Momentum
- money
- movement
- nearly
- necessary
- negative
- news
- opening
- Opinions
- opportunities
- Optimism
- Outlook
- own
- perspective
- picture
- placing
- plato
- Plato Data Intelligence
- PlatoData
- Point
- positions
- positive
- possibility
- possible
- Prepare
- preparing
- pressure
- price
- Price Analysis
- price chart
- Prices
- Profit
- pullback
- purchase
- purchasing
- Reader
- Reading
- recent
- research
- Resistance
- Respond
- responsible
- Rise
- Risen
- Sellers
- shift
- Short
- short-term
- should
- Signal
- since
- So
- Soon
- Source
- Starting
- stay
- Still
- subsequent
- substantial
- Suggests
- Take
- taking
- The
- their
- thing
- time
- to
- trade
- Traders
- TradingView
- Trend
- trending
- Trends
- uptrend
- value
- Values
- volume
- Waiting
- What
- What is
- while
- writing
- zephyrnet