SNEAK PEEK
- Cumberland’s Ethereum withdrawal hints at a market shift, impacting sentiment.
- Bears dominate as ETH prices decline, triggering caution among investors.
- Traders urged to assess opportunities amidst cautious market sentiment.
With 37,600 Ethereum (ETH) ($69 million) now withdrawn, it is clear that Cumberland is taking a cautious approach to their investments. Cumberland’s significant withdrawal of Ethereum from both Binance and Coinbase signals a major shift in the market. This move indicates that they are anticipating a market downturn or simply looking to diversify their portfolio.
Cumberland withdrew 8,250 $ETH ($15M) from #Binance and 4,500 $ETH ($8M) from #Coinbase again.
A total of 37,600 $ETH ($69M) has been withdrawn.https://t.co/YzPbuAi980 pic.twitter.com/5fUgVcc9R5
— Lookonchain (@lookonchain) June 7, 2023
Regardless of the reason, this withdrawal might seriously impact the overall market sentiment toward Ethereum. However, bears have taken control of the Ethereum market in the past 24 hours, driving prices from an intraday high of $1,883.66 to an intraday low of $1,822.30. As of this writing, ETH was trading at $1,839.56, a 2.02% decrease from its previous close.
ETH’s market capitalization and 24-hour trading volume decreased by 2.01% and 22.81% to $221,182,586,303 and $7,195,259,742, respectively. Investors’ uncertainty and caution as they closely monitor the ETH market and postpone making sizable investments until they see a recovery are to blame for this decline.
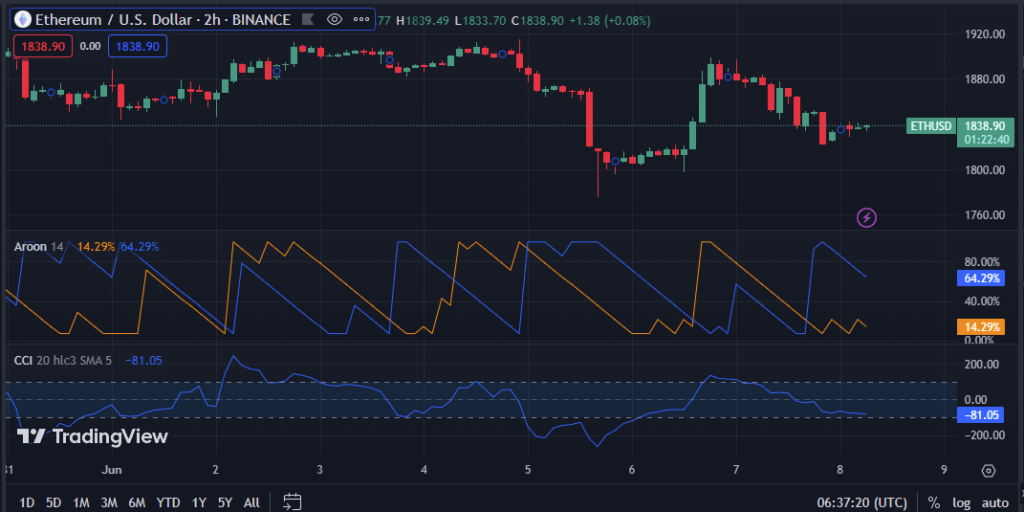
The Aroon up and down readings are 14.29% and 64.29%, respectively, on the 2-hour price chart for the ETH market. This pattern indicates strong bearish pressure and suggests that further price declines may be imminent. Traders should pay close attention to these readings and consider opening short positions or selling their existing holdings.
On the 2-hour price chart, the Commodity Channel Index (CCI), which has a line pointing south and a value of -80.52, is in negative territory, suggesting that the market may be oversold. As a result, traders should exercise caution when taking long positions because this suggests that the market is moving in a bearish direction.
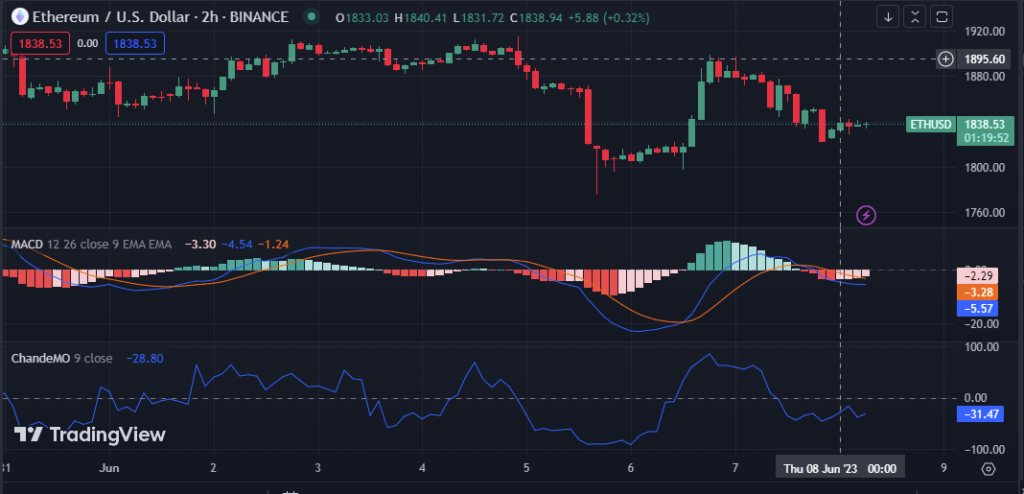
The MACD blue line, which runs beneath its signal line on the 2-hour price chart and has a value of -5.58, is oriented southward, indicating a downward trend in the price of ETH. Investors should consider selling ETH or postponing further investments until the market trend changes because the market is in a downturn.
The Chande Momentum Oscillator (ChandeMo) is in the negative region on the 2-hour price chart of the ETH market with a reading of -31.73. This move shows that the market is in a bearish trend currently and that there might be more rapid downward movement. Until the momentum changes to a more bullish direction, traders and investors may interpret this as a signal to sell or hold off on buying.
In conclusion, ETH’s recent significant withdrawal and bearish market indicators signal caution, leading to a decline. Traders and investors should carefully assess the situation, consider short positions, and monitor for a potential market recovery.
Disclaimer: Cryptocurrency price is highly speculative and volatile and should not be considered financial advice. Past and current performance is not indicative of future results. Always research and consult with a financial advisor before making investment decisions
- SEO Powered Content & PR Distribution. Get Amplified Today.
- EVM Finance. Unified Interface for Decentralized Finance. Access Here.
- Quantum Media Group. IR/PR Amplified. Access Here.
- PlatoAiStream. Web3 Data Intelligence. Knowledge Amplified. Access Here.
- Source: https://investorbites.com/ethereum-eth-price-analysis-08-06/
- :has
- :is
- :not
- $UP
- 14
- 195
- 22
- 24
- 250
- 30
- 500
- 66
- 7
- 8
- a
- advice
- advisor
- again
- always
- amidst
- among
- an
- analysis
- and
- anticipating
- approach
- ARE
- AS
- assess
- At
- attention
- BE
- bearish
- bearish market
- Bears
- because
- been
- before
- binance
- Blue
- both
- Bullish
- Buying
- by
- capitalization
- carefully
- caution
- cautious
- Center
- Changes
- Channel
- charge
- Chart
- clear
- Close
- closely
- coinbase
- commodity
- conclusion
- Consider
- considered
- control
- Current
- Currently
- Decline
- Declines
- decrease
- direction
- discussion
- diversify
- dominate
- down
- DOWNTURN
- downward
- driving
- ETH
- eth market
- ETH/USD
- ethereum
- ethereum (ETH)
- Ethereum News
- Ethereum Price
- Ethereum Price Analysis
- Exercise
- existing
- extensive
- external
- financial
- financial advice
- For
- from
- further
- future
- Have
- High
- highly
- hints
- hold
- Holdings
- HOURS
- However
- HTTPS
- Impact
- impacting
- in
- index
- indicates
- indicating
- indicative
- Indicators
- internal
- investment
- Investments
- investor
- Investors
- IT
- ITS
- leading
- Line
- Long
- looking
- Low
- MACD
- major
- Making
- Market
- Market Capitalization
- market downturn
- Market News
- market sentiment
- max-width
- May..
- might
- million
- Momentum
- Monitor
- more
- move
- movement
- moving
- negative
- negative territory
- news
- now
- of
- off
- on
- opening
- opportunities
- or
- overall
- past
- Pattern
- Pay
- performance
- plato
- Plato Data Intelligence
- PlatoData
- portfolio
- positions
- potential
- previous
- price
- Price Analysis
- price chart
- Prices
- rapid
- Reading
- reason
- recent
- recovery
- region
- research
- respectively
- result
- Results
- s
- see
- sell
- Selling
- sentiment
- shift
- Short
- should
- Shows
- Signal
- signals
- significant
- simply
- situation
- sizable
- Source
- South
- Sparks
- speculative
- Suggests
- Take
- taken
- taking
- territory
- that
- The
- their
- There.
- These
- they
- this
- to
- Total
- toward
- Traders
- Trading
- trading volume
- TradingView
- Trend
- triggering
- Uncertainty
- until
- value
- volatile
- volume
- was
- What
- What is
- when
- which
- with
- withdrawal
- writing
- zephyrnet