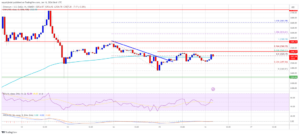
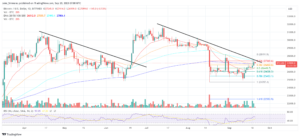
Ethereum price failed to reclaim $1,750 and trimmed all gains against the US Dollar. ETH could accelerate lower if it breaks the $1,630 support.
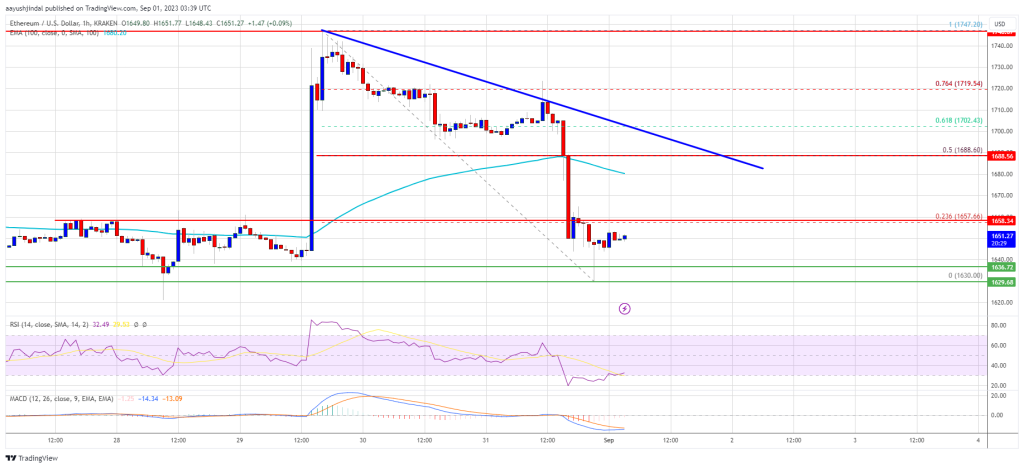
- Ethereum started a fresh decline below the $1,700 level.
- The price is trading below $1,700 and the 100-hourly Simple Moving Average.
- There is a key bearish trend line forming with resistance near $1,690 on the hourly chart of ETH/USD (data feed via Kraken).
- The pair could extend its decline if there is a close below the $1,630 support.
Ethereum Price Trimmed Gains
Ethereum’s price failed to settle above the $1,700 level. ETH started a fresh decline and gained bearish momentum below the $1,700 level, like Bitcoin.
There was a clear move below the $1,665 level and the price spiked below the $1,640 level. It tested the $1,630 support and is currently consolidating losses. Ether is now trading below $1,700 and the 100-hourly Simple Moving Average.
Besides, there is a key bearish trend line forming with resistance near $1,690 on the hourly chart of ETH/USD. On the upside, the price might face resistance near the $1,660 level and the 23.6% Fib retracement level of the recent decline from the $1,747 swing high to the $1,630 low.
The next resistance is near the $1,680 level. The main resistance is now forming near the trend line and $1,700. It is close to the 50% Fib retracement level of the recent decline from the $1,747 swing high to the $1,630 low.
Source: ETHUSD on TradingView.com
A close above the $1,700 level might send the price toward the $1,750 zone. If there is a clear move above $1,750, Ethereum could climb toward the $1,800 resistance. Any more gains might send the price toward the $1,850 resistance.
More Losses in ETH?
If Ethereum fails to clear the $1,700 resistance, it could continue to move down. Initial support on the downside is near the $1,640 level.
The first key support is close to $1,630. The next major support is near the $1,600 level. If there is a downside break below $1,600, the price could extend its decline toward the $1,540 level. Any more losses might send the price toward the $1,480 level in the near term.
Technical Indicators
Hourly MACD – The MACD for ETH/USD is losing momentum in the bearish zone.
Hourly RSI – The RSI for ETH/USD is now below the 50 level.
Major Support Level – $1,630
Major Resistance Level – $1,700
- SEO Powered Content & PR Distribution. Get Amplified Today.
- PlatoData.Network Vertical Generative Ai. Empower Yourself. Access Here.
- PlatoAiStream. Web3 Intelligence. Knowledge Amplified. Access Here.
- PlatoESG. Automotive / EVs, Carbon, CleanTech, Energy, Environment, Solar, Waste Management. Access Here.
- PlatoHealth. Biotech and Clinical Trials Intelligence. Access Here.
- ChartPrime. Elevate your Trading Game with ChartPrime. Access Here.
- BlockOffsets. Modernizing Environmental Offset Ownership. Access Here.
- Source: https://www.newsbtc.com/analysis/eth/ethereum-faces-rejection-1750/
- :is
- 1
- 23
- 50
- 700
- a
- above
- accelerate
- again
- against
- All
- and
- any
- average
- bearish
- Bearish Momentum
- below
- Break
- breaks
- Bulls
- CAN
- Chart
- clear
- climb
- Close
- consolidating
- continue
- could
- Currently
- data
- Decline
- Dollar
- down
- downside
- ETH
- ETH/USD
- Ether
- ethereum
- ethereum could climb
- Ethereum Price
- extend
- Face
- faces
- Failed
- fails
- First
- For
- fresh
- from
- gained
- Gains
- High
- HTTPS
- if
- in
- initial
- IT
- ITS
- Key
- Kraken
- Level
- like
- Line
- losing
- losses
- Low
- lower
- MACD
- Main
- major
- max-width
- might
- Momentum
- more
- move
- moving
- moving average
- Near
- NewsBTC
- next
- now
- of
- on
- pair
- plato
- Plato Data Intelligence
- PlatoData
- price
- protect
- recent
- Resistance
- retracement
- rsi
- send
- settle
- Simple
- started
- support
- support level
- Swing
- term
- tested
- The
- There.
- this
- to
- toward
- Trading
- TradingView
- Trend
- Upside
- us
- US Dollar
- via
- was
- with
- yet
- zephyrnet