Published 48 mins ago
In the last four days of price action, the Blur token price has shown the formation of an ascending triangle pattern. The formation of an ascending triangle pattern indicates that buying pressure is gradually rising in the Blur token price. With today’s strong bullish candle, the coin price breached this pattern’s $1.225 neckline resistance, offering a prolonged recovery opportunity for holders. Here’s how this bullish pattern influences the future price of the Blur token.
advertisement
Key Points:
- Blur has gained popularity among professional NFT traders, who prefer the platform for their trading activities due to its advanced features and competitive advantages.
- A bullish breakout from the $1.22 neckline resistance of the triangle pattern sets Blur token price on a 50% rally.
- The intraday trading volume in Blur is $624.5 Million, indicating a 6.7% loss.
About BLUR token
The blockchain project BLUR was launched in October 2022 and quotes itself as an NFT marketplace for pro traders. The project offers an advanced marketplace with a variety of features, such as real-time price feeds, portfolio management, and multi-marketplace NFT comparisons. It boasts faster NFT sweeps at 0% Market fees and a more user-friendly interface compared to competitors.
BLUR is a native governance token of this Ethereum-based platform, which allows users to participate in platform governance and decision-making.
The platform has recently conducted a series of airdrops that offered its users BLUR tokens through Care Packages. These Care Packages were divided into four different rarity tiers and were distributed among those users who actively participated in beta testing six months prior to its official launch
Trending Stories
The second airdrop was specifically targeted toward traders who listed their products on the platform’s marketplace in November 2022, while the third airdrop was reserved for traders who placed bids on Blur until February 14, 2023.
Moreover, Blur outperforms its competitors, particularly in the domain of NFT creator royalties. The platform has been designed to benefit artists by offering them additional BLUR tokens as an incentive to those who pay royalties. As a crypto analyst, it is interesting to observe how Blur is attempting to differentiate itself from other similar platforms by placing emphasis on the value of creators and incentivizing their participation in the ecosystem.
Also Read- Explained: What is Physical NFT? and How to Sell Physical Items as NFT
Price analysis- Daily Chart
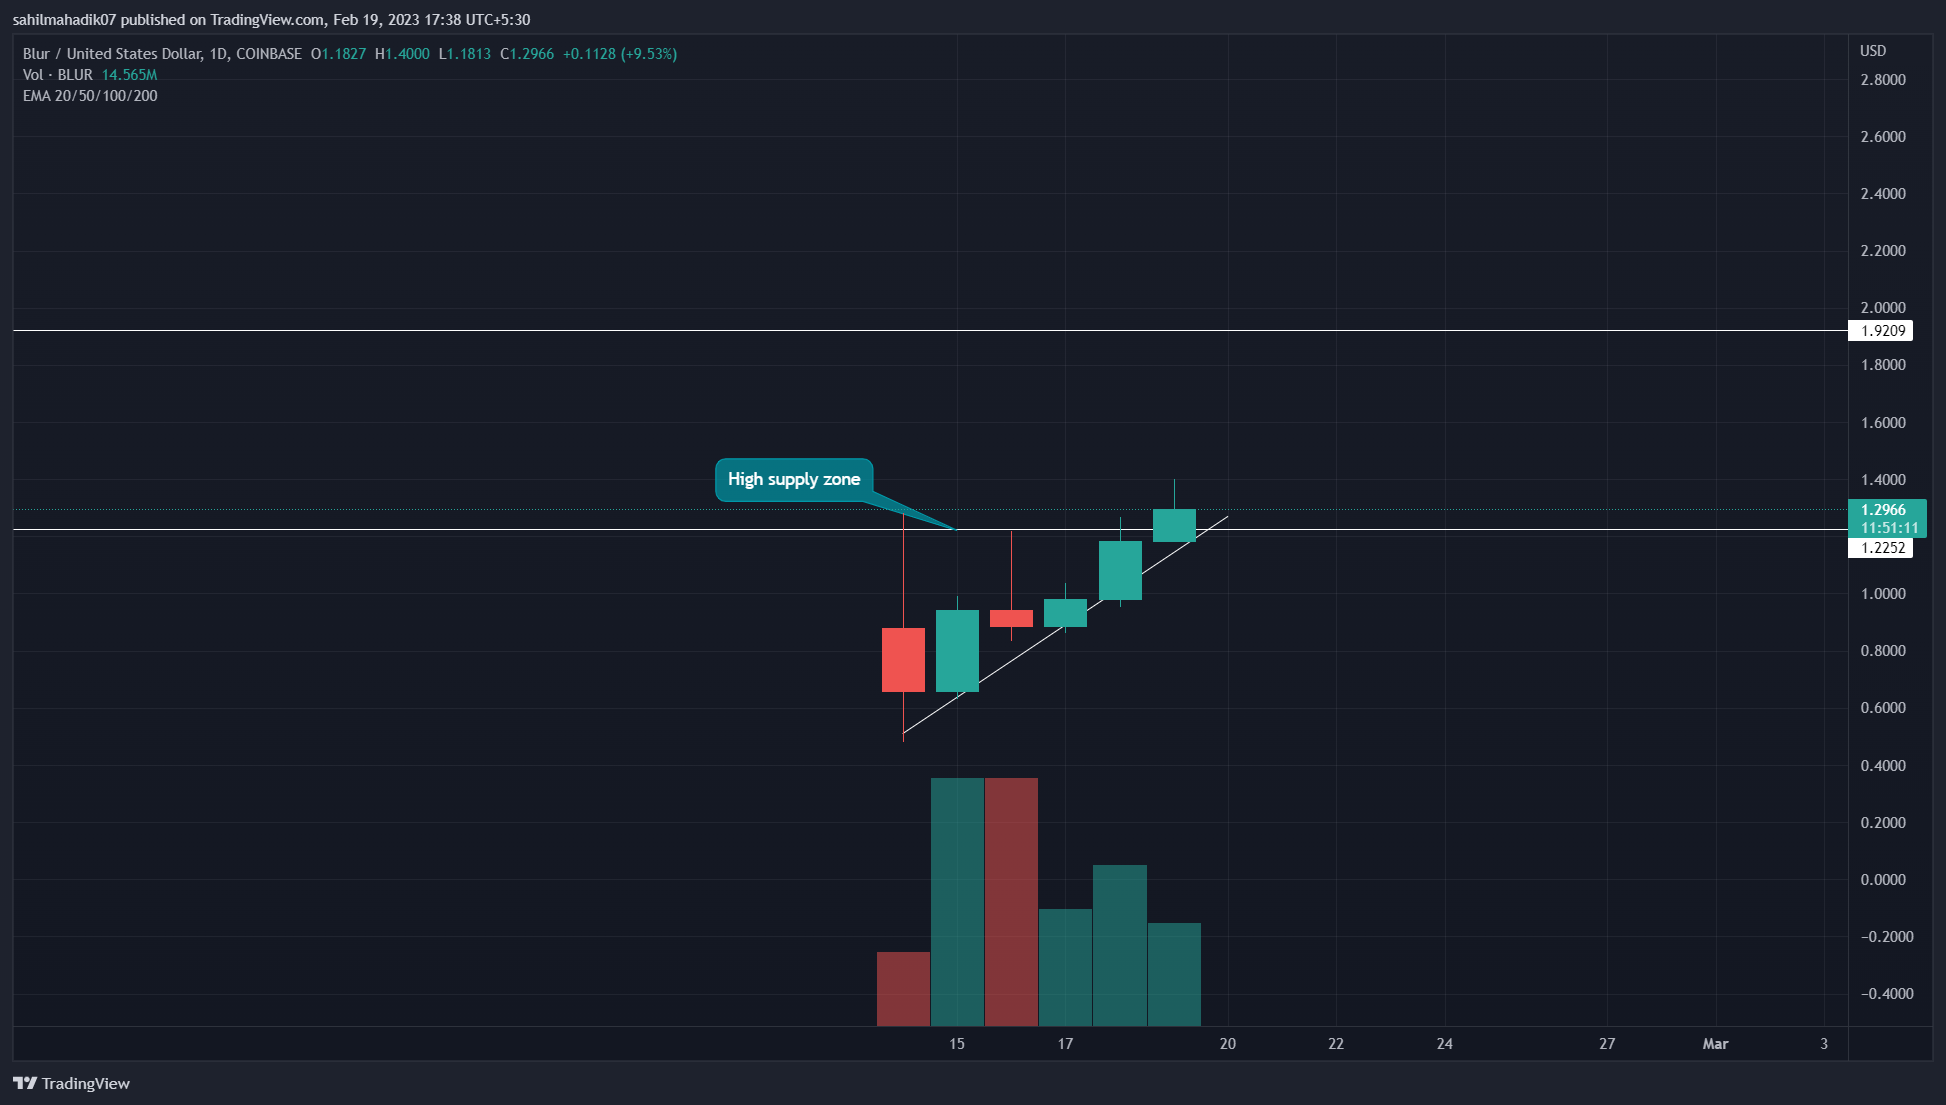
Source- tradingview
In the daily time frame chart, the Blur token price has shown a steady rally since its launch on 14th February. However, the candles were attached with long-higher price rejection wicks, indicating the coin price was experiencing high supply pressure from the $1.22 mark.
Having said that, the Blur price witnessed a significant inflow today and breached the aforementioned resistance. Today, the altcoin is 10% up, and currently, the exchange handles at the $1.3 mark.
If the daily candle closes above $1.22, the buyers will get a significant footing to lead a further rally.
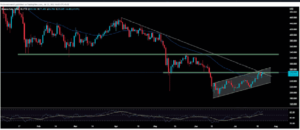
Bullish Pattern Spotted In 4-Hour Chart
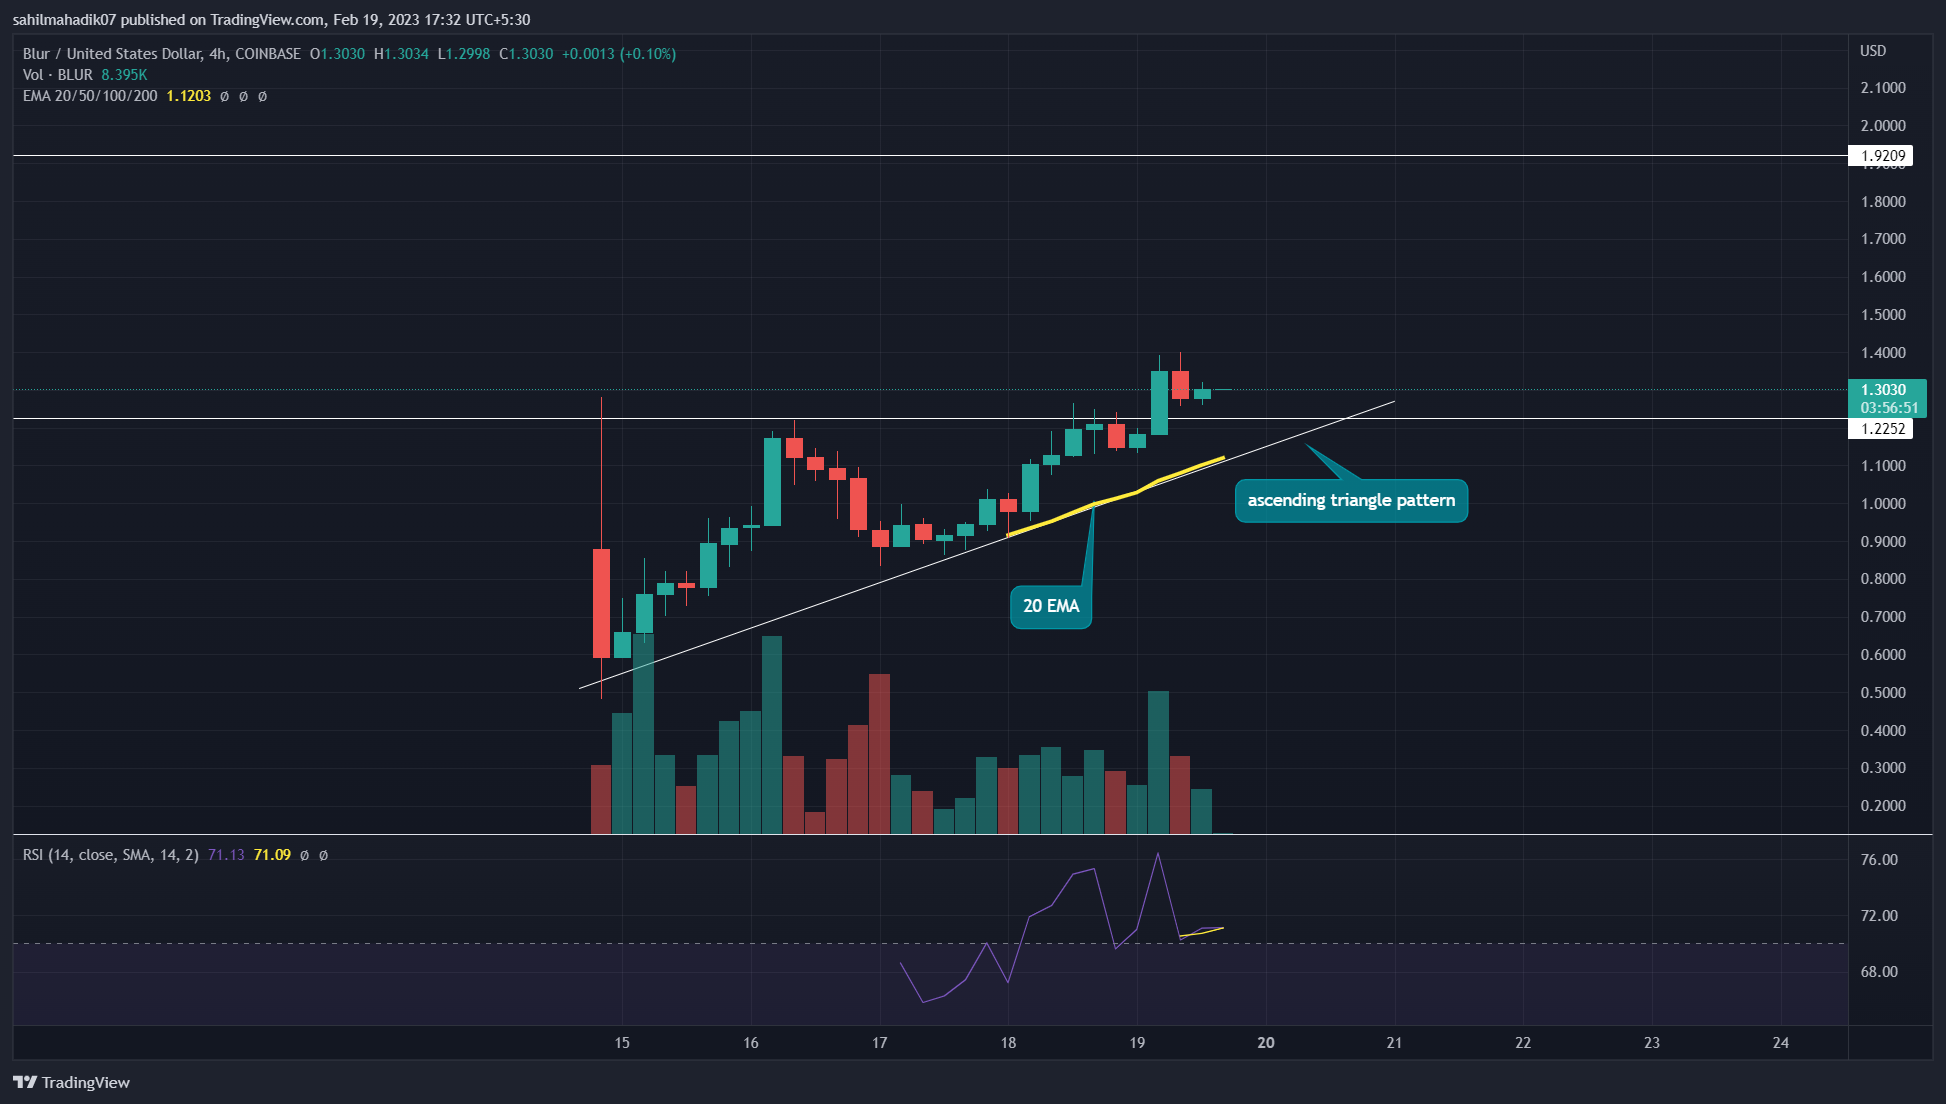
Source- tradingview
The Blue token price shows the formation of an ascending triangle pattern in the daily time frame chart. It is a bullish continuation pattern that typically forms during an uptrend. The pattern consists of two main components: a horizontal resistance level and a rising trendline. The horizontal resistance line is formed by a series of price highs that fail to break higher. On the other hand, the rising trendline is formed by a series of higher lows.
As the pattern progresses, the price of the asset tends to get squeezed between the horizontal resistance line and the rising trendline, creating a triangle-like shape. The ascending triangle pattern is complete when the price breaks above the horizontal resistance line, which typically signals a bullish continuation of the uptrend.
Thus, as mentioned above, the rising Blur price pierced the $1.22 ceiling, which is also the neckline resistance of the triangle pattern. However, the coin price has reverted slightly and retested the breached resistance as potential support.
During the retest phase, If the altcoin shows sustainability above the $1.22 support, interested traders could look for an entry opportunity. Under the favorable condition, the triangle pattern offers a potential target of the same length between its neckline resistance and earliest swing long shot breakout at the breakout point.
Therefore, the potential rally could drive the Blur token 50% up to revisit the $1.92 mark.
Technical Indicator
EMAs: Along with the rising trendline, the 20 EMA slope(yellow) offers dynamic support to rising blur prices. Thus, the coin holders could expect a strong rally until this EMA slope is intact.
advertisement
RSI: The daily RSI slope wavering high in the bullish territory indicates the buyers are aggressive in nature.
Blur Coin Price Intraday Levels
- Spot rate: $1.29
- Trend: Bullish
- Volatility: Medium
- Resistance level- $1680 and $1788
- Support level- $1500 and $1420
Share this article on:
advertisement
The presented content may include the personal opinion of the author and is subject to market condition. Do your market research before investing in cryptocurrencies. The author or the publication does not hold any responsibility for your personal financial loss.
<!– Close Story–>
- SEO Powered Content & PR Distribution. Get Amplified Today.
- Platoblockchain. Web3 Metaverse Intelligence. Knowledge Amplified. Access Here.
- Source: https://coingape.com/markets/emerging-bullish-pattern-sets-blur-price-for-a-prolonged-50-rally/
- $1500
- 1
- 10
- 2022
- 2023
- 7
- 9
- a
- above
- Action
- actively
- activities
- Ad
- Additional
- advanced
- advantages
- aggressive
- airdrop
- Airdrops
- allows
- Altcoin
- among
- analyst
- and
- article
- Artists
- asset
- attempting
- author
- avatar
- banner
- Beauty
- before
- benefit
- beta
- between
- blockchain
- Blue
- blur
- boasts
- Break
- breakout
- breaks
- Brian
- Bullish
- buyers
- Buying
- care
- ceiling
- Chart
- Closes
- Coin
- Coingape
- COM
- compared
- competitive
- competitors
- complete
- components
- condition
- content
- continuation
- could
- Creating
- creator
- creator royalties
- creators
- crypto
- crypto analyst
- cryptocurrencies
- cryptocurrency
- Currently
- daily
- Days
- Decision Making
- designed
- different
- differentiate
- distributed
- divided
- domain
- drive
- during
- dynamic
- ecosystem
- EMA
- emerging
- emphasis
- Entertainment
- entry
- Ether (ETH)
- Ethereum-based
- exchange
- expect
- experiencing
- FAIL
- Fashion
- faster
- Features
- February
- Fees
- finance
- financial
- follow
- formation
- formed
- forms
- FRAME
- from
- further
- future
- Future Price
- get
- governance
- gradually
- hand
- Handles
- High
- higher
- Highs
- hold
- holders
- Horizontal
- How
- How To
- However
- HTTPS
- in
- Incentive
- include
- Including
- indicates
- indicating
- interested
- interesting
- Interface
- investing
- IT
- items
- itself
- journalism
- Last
- launch
- launched
- lead
- Length
- Level
- Line
- Listed
- Long
- Look
- loss
- Lows
- Main
- management
- mark
- Market
- market research
- marketplace
- mentioned
- million
- months
- more
- native
- Nature
- NFT
- November
- observe
- october
- offered
- offering
- Offers
- official
- Opinion
- Opportunity
- Other
- Outperforms
- packages
- participate
- participated
- participation
- particularly
- past
- Pattern
- Pay
- personal
- phase
- physical
- placing
- platform
- Platforms
- plato
- Plato Data Intelligence
- PlatoData
- plugin
- Point
- points
- popularity
- portfolio
- portfolio management
- potential
- prefer
- presented
- pressure
- price
- PRICE ACTION
- Prices
- Prior
- Pro
- Products
- professional
- project
- Publication
- rally
- rarity
- Rate
- real-time
- recently
- recovery
- research
- reserved
- Resistance
- responsibility
- rising
- royalties
- Said
- same
- Second
- sell
- Series
- Sets
- Shape
- Share
- shown
- Shows
- signals
- significant
- similar
- since
- SIX
- Six months
- Slope
- specifically
- steady
- strong
- subject
- such
- supply
- support
- Sustainability
- Target
- targeted
- Testing
- The
- The Future
- their
- Third
- Through
- time
- to
- today
- today’s
- token
- Tokens
- Topics
- toward
- Traders
- Trading
- trading volume
- TradingView
- trending
- typically
- under
- uptrend
- user-friendly
- users
- value
- variety
- volume
- What
- What is
- which
- while
- WHO
- will
- witnessed
- working
- written
- years
- Your
- zephyrnet