Michael Allen peers into the depths of natural disasters, as he speaks to the physicists who are using muon tomography to get a better understanding of volcanoes and tropical cyclones

Scientists and engineers are always trying to build better early-warning systems to mitigate the damage to life and property caused by natural disasters such as volcanoes. One technique that researchers are increasingly turning to is, in many ways, heaven-sent. It involves using muons: subatomic particles produced when cosmic rays – mostly high-energy protons originating from events such as supernovae – collide with atoms 15–20 kilometres high up in our atmosphere.
We know that the Earth’s atmosphere is constantly being hit by these primary cosmic rays, with the collisions producing a shower of secondary particles, including electrons, pions, neutrinos and muons. In fact, as many as 10,000 muons from these secondary cosmic rays rain down on each square metre of the Earth’s surface every minute. These particles have all the same properties as electrons but around 200 times the mass, which means they can travel much further through solid structures than electrons.
But what makes muons interesting as a probe is that interactions between the muons and the materials they’re passing through affect their flux, with denser objects deflecting and absorbing more muons than less-dense structures can. It is this difference in flux that is being used to image the internal structure of volcanoes in a technique known as “muography”. The term was coined back in 2007 by Hiroyuki Tanaka at the University of Tokyo and his colleagues, who provided the first demonstration that voids and cavities within the volcano could be detected with the technique (Earth Planet. Sci. Lett. 263 1–2).
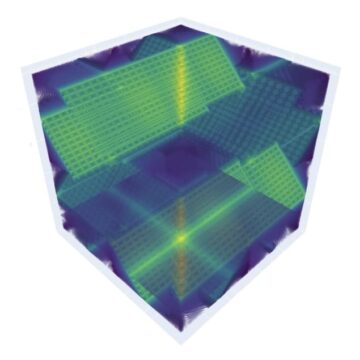
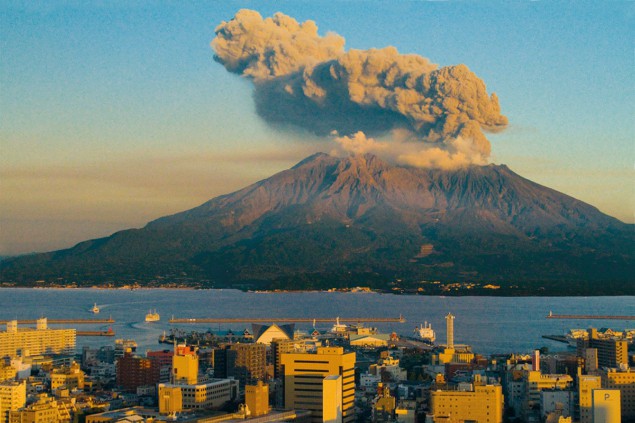
Also known as muon tomography, it uses detectors to produce a reverse density map of the object the muons have passed through. Spots where more muons hit the sensors represent less dense areas of the structure, while fewer muons highlight denser parts. Tanaka and colleagues have even tried to forecast volcanic eruptions using muography combined with an AI deep-learning convolutional neural network. In 2020 they used this technique to study one of the world’s most active volcanoes – the Sakurajima volcano in southern Japan (see above), which has erupted 7000 times in the past decade (Sci. Rep. 10 5272).
Drawing with muons
Muography is very similar to radiography, according to Jacques Marteau, a particle physicist at the Institute of Physics of the 2 Infinities (IP2I) in Lyon, France. “It replaces X-rays from medical imaging with another particle, namely the muon,” he says. “Muography is basically an imaging process that scans the density of an object in exactly the same way as X-ray imaging.”
Muography is an imaging process that scans the density of an object in exactly the same way as X-ray imaging
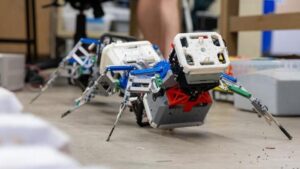
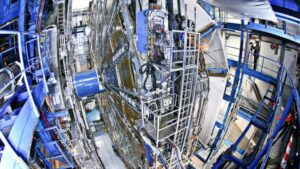
Several different devices can be used to detect muons, most of which have been developed as part of particle-physics experiments, such as at the Large Hadron Collider at CERN. When it comes to imaging volcanoes, however, the most commonly used detectors consist of layers of scintillators. As the muons pass through the detector, each layer produces a flash of light that together can be used to reconstruct the incoming trajectory of the particles. The detectors are placed on the lower slopes of the volcano and are angled to detect the muons that pass through it.
But muography has not only been used to image the internal structure of volcanoes. Researchers have also used the technique to detect changes in density within volcanoes linked to rising magma, as well as changes in magma shape, hydrothermal activity and pressure in the cavities and conduits.
Volcanic peeks
Giovanni Macedonio, research director at the National Institute of Geophysics and Volcanology in Rome, Italy, explains that there are three main techniques for studying and monitoring volcanoes. One is to use seismic data. Another is to measure ground deformations with satellites, while a third involves analysing the geochemistry of the fluids in the volcano.
Muography makes it possible to study fluid dynamics because it allows you to see the internal structure of the upper part of the volcano, particularly in smaller volcanoes. This not only reveals the path the magna took in past eruptions, but also makes it possible to model potential activity during future eruptions. Details of the internal geometry, for example, could show where on the cone an eruption might occur and how powerful it could be.
Macedonio and colleagues are studying using muography to study Mount Vesuvius as part of a research project known as MURAVES (J. Inst. 15 C03014). Infamous for its destruction of the Roman cities of Pompeii and Herculaneum, Vesuvius remains an active volcano and is a dangerous, brooding presence, particularly as so many people live close by. During the last eruption in 1944, part of the crater was thrown off the volcano, but some dense magma has solidified in the crater.

What MURAVES aims to do is to learn about the internal structure of the volcano following eruptions in the 19th and 20th centuries, so that its future behaviour can be modelled. As volcanoes are dynamic environments, their structure changes, particularly during eruptions, which can affect how they behave in the future.
Macedonio is also using muons to study Mount Stromboli, an active volcano in the Aeolian Islands, off the north coast of Sicily. Studying the internal structures of both active and dormant volcanoes can help us understand volcanic behaviour and explain why they generate small or large eruptions. “The internal structure, the geometry of the conduits, is an important parameter that determines the dynamics of the volcano,” says Macedonio. This information from active volcanoes can then be used to help model and predict how other volcanoes might behave.
As for Marteau, he has been using muography to study the La Soufrière volcano on the French island of Basse-Terre in the Caribbean. The volcano’s relatively small dome, Marteau explains, can easily be destabilized by activities such as earthquakes and magna movements. This can depressurize cavities filled with hot, high-pressure steam, leading to what is known as a “phreatic” eruption. These are volcanic eruptions that involve high-temperature liquids and vapours, rather than magma.
While such eruptions are not as well known as those involving magma, they can still be powerful and dangerous. In September 2014, for example, the southwestern side of the Ontake volcano in Japan erupted with little warning, killing 63 people who had been hiking on the mountain (Earth Planets Space 68 72). The steam eruption created an enormous, 11-kilometre-high plume.
In the case of volcanos like La Soufrière, what dictates whether an eruption will happen or not is the mechanical structure of the dome. “You need a technique like muography to understand what and where are the weak points,” Marteau says.
Muography can also be used to monitor the dynamics of fluids in volcanos like La Soufrière. Inside many volcanoes, Marteau explains, there is lots of fluid circulating between different cavities. While the fluids may be liquid, increases in magma activity and heat deep in the volcano can turn them into steam.
With muography you can observe these changes in fluid dynamics within the dome. For instance, if the liquids in one cavity turn to steam there will be a decrease in density, and an increase in muon flux.
Such a change – a filling of a cavity with steam under pressure – is something that could cause an eruption. “This is something you can follow in real time with muography, and this is the only technique that is able to do this,” Marteau says.
In 2019, Marteau and his colleagues demonstrated that muography in combination with seismic-noise monitoring can detect abrupt changes in hydrothermal activity in the dome of the La Soufrière volcano (Sci. Rep. 9 3079).
The flux before the storm
Tanaka, who pioneered the use of muons to image volcanoes, has now set his sights on another dangerous natural hazard: tropical cyclones. Reaching speeds of more than 120 kilometres per hour, these rotating storms cause huge amounts of damage to property and are responsible for many deaths every year. They originate over tropical oceans and are known as hurricanes, typhoons or, simply, cyclones, depending on where in the world they occur.
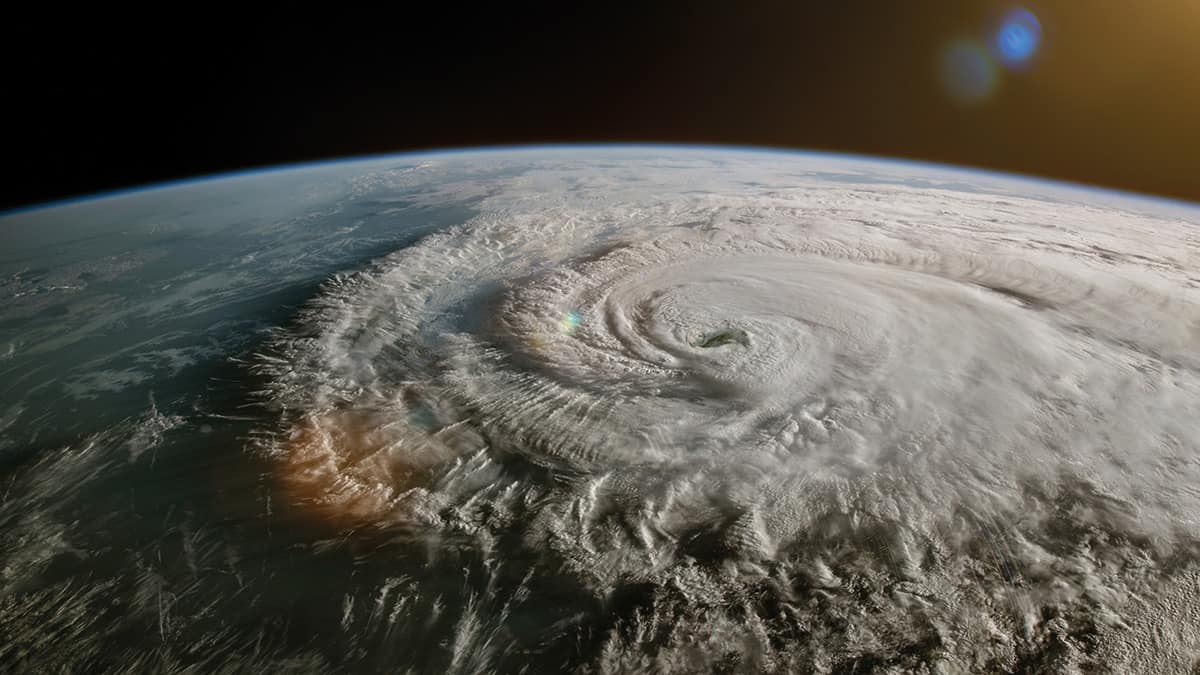
Cyclones develop when low-pressure air is heated over the warm tropical ocean. Over time, this creates a warm, moist column of rapidly rising air; causing a low-pressure depression to develop at the surface of the ocean. This further strengthens the convection currents, leading to the development of a powerful rotating storm system that gets stronger and stronger.
These tropical storms are currently predicted, monitored and tracked using satellites, radar and other weather data. Reinforced aircraft can even be flown through them to collect data such as air pressure. But none of these techniques provide any detail about the differences in air pressure and density throughout the cyclone. It is these gradients that drive the convection currents and the wind speed.
On Kyushu Island – the southernmost of Japan’s five main islands and a hot spot for cyclones – Tanaka and his team are now investigating how the change in muon flux can show differences in air density and pressure in the cyclone, providing information on wind speed and storm strength. According to Tanaka, their network of scintillator detectors on Kyushu Island can image storms up to about 150 kilometres away. This is possible because while some cosmic rays enter the atmosphere vertically, others hit much more horizontally, creating muons that fly towards the Earth at very shallow angles and can travel as far as 300 km before hitting the ground.
Denser air absorbs more muons, so their flux provides a measure of the density – and therefore the pressure and temperature – of the air at multiple points throughout a cyclone. As a result, Tanaka’s team can create an image of the temperature and pressure gradients inside the cyclone. “[Using this technique] we can measure the horizontal and vertical speed of the wind inside the cyclone,” says Tanaka, whose team has used muography to observe eight cyclones approaching the city of Kagoshima. The resulting images captured the warm low-pressure cores of the cyclones, surrounded by denser, colder, high-pressure air (Sci. Rep. 12 16710).

Using more muon detectors, Tanaka hopes that it will be possible to create more detailed 3D images of the energy structures inside cyclones. “I anticipate that with muography we can predict how strong a cyclone will be and how much rain it will bring to the ground,” Tanaka says. “This is probably something that can be used for early-warning systems.”
Changing tides
Tanaka has also been using muography to measure another hazard linked to cyclones: meteotsunamis. Short for meteorological tsunamis, they occur in enclosed or semi-closed water bodies like bays and lakes. Unlike tsunamis, which are the result of seismic activity, they are caused by abrupt changes in atmospheric pressure or winds, such as those caused by cyclones and weather fronts.
The extreme water oscillations of meteotsunamis can last from a few minutes to several hours, and can cause significant damage. For instance, 75 people were injured on 4 July 1992 when a meteotsunami hit Daytona Beach in eastern Florida in the US (Nat. Hazards 74 1–9). With waves reaching three metres in height, the meteotsunami was caused by a squall line – a fast-moving system of thunderstorms.
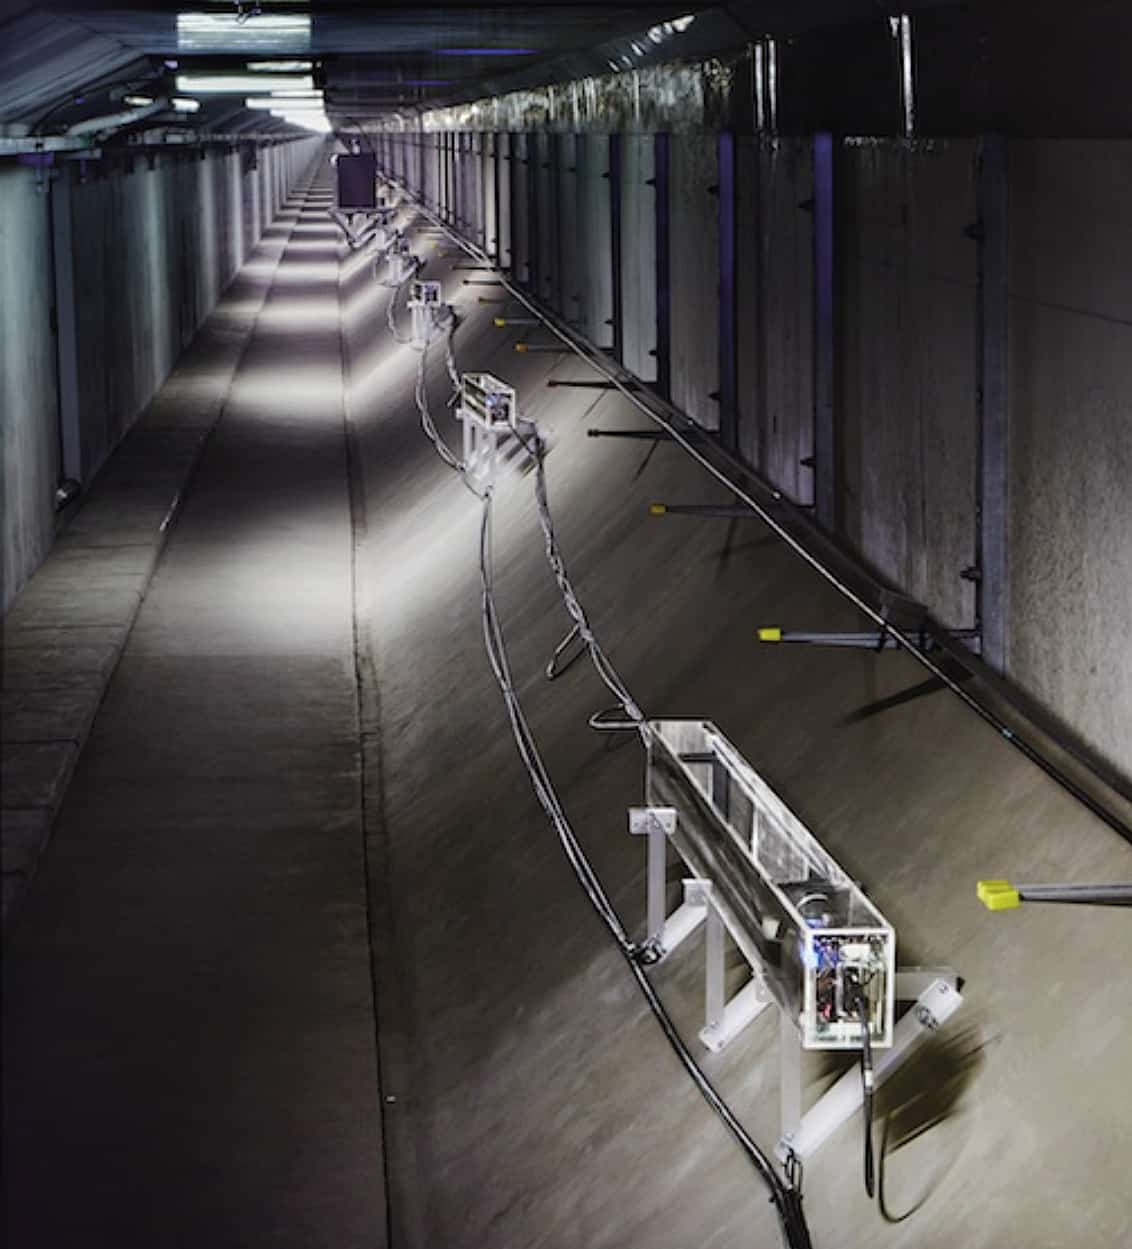
The Tokyo-Bay Seafloor Hyper-Kilometric Submarine Deep Detector (TS-HKMSDD) is a line of muon detectors installed in a nine-kilometre-long road tunnel under Tokyo Bay. The sensors measure muons passing through the water above.
In September 2021 a cyclone travelled through the Pacific about 400 km south of Tokyo Bay. As the storm passed, a large swell moved through Tokyo Bay and the number of muons detected by the TS-HKMSDD fluctuated. The extra water volume caused more muons to scatter and decay, and the numbers reaching the detectors dropped. When the team checked their muon data, they found that it closely matched measurements from the tide gauge (Sci. Rep. 12 6097).
To measure swells, the detectors do not need to be in a tunnel under the water body. “We can detect anywhere with an underground space near the seashore,” he explains. This could include road and subway tunnels near the shoreline, and other underground spaces like parking lots and commercial basements.
As with cyclones, detecting meteotsunamis would rely on the detectors sensing muons travelling at shallow angles through the atmosphere, and then through the water and shoreline. According to Tanaka, such setups could measure water levels up to about three to five kilometres from the shore. “We don’t want to know the moment [the meteotsunami] arrives,” he says. “We want to know before it hits land.”
Tanaka believes that such systems could also be used to measure tide levels and create a dense tide-monitoring network. After all, muon detectors have one big advantage over mechanical tide gauges: they are not in contact with the water. This makes them more reliable because they do not wear out over time and cannot be damaged by large storms. In fact, TS-HKMSDD in the Tokyo Bay Aqua-Line tunnel measured continuously for a year with not even a single second’s worth of missing data. Who’d have thought that the humble muon could do so much to prepare us against natural disasters?
- SEO Powered Content & PR Distribution. Get Amplified Today.
- PlatoData.Network Vertical Generative Ai. Empower Yourself. Access Here.
- PlatoAiStream. Web3 Intelligence. Knowledge Amplified. Access Here.
- PlatoESG. Automotive / EVs, Carbon, CleanTech, Energy, Environment, Solar, Waste Management. Access Here.
- BlockOffsets. Modernizing Environmental Offset Ownership. Access Here.
- Source: https://physicsworld.com/a/earth-wind-and-water-how-cosmic-muons-are-helping-to-study-volcanoes-cyclones-and-more/
- :has
- :is
- :not
- :where
- $UP
- 000
- 10
- 15%
- 200
- 2014
- 2019
- 2020
- 2021
- 2022
- 300
- 3d
- 75
- a
- Able
- About
- above
- absorbs
- AC
- Academia
- According
- active
- activities
- activity
- ADvantage
- affect
- After
- against
- AI
- aims
- AIR
- aircraft
- AL
- All
- allows
- also
- always
- amounts
- an
- and
- Another
- anticipate
- any
- anywhere
- approaching
- ARE
- AREA
- areas
- around
- Array
- Arrives
- AS
- assisting
- At
- Atmosphere
- atmospheric
- away
- back
- based
- Basically
- Bay
- BE
- Beach
- because
- been
- before
- being
- believes
- berlin
- Better
- between
- Big
- bodies
- body
- both
- Bottom
- bring
- build
- but
- by
- CAN
- cannot
- capture
- captured
- Caribbean
- case
- Cause
- caused
- causing
- cavities
- centuries
- CERN
- change
- Changes
- checked
- circulating
- Cities
- City
- click
- Close
- closely
- Coast
- coined
- colleagues
- collect
- Collide
- Column
- combination
- combined
- comes
- commercial
- commonly
- Configuration
- consists
- constantly
- contact
- continuously
- convolutional neural network
- Cosmic rays
- could
- create
- created
- creates
- Creating
- Currently
- damage
- Dangerous
- data
- deaths
- decade
- decrease
- deep
- demonstrated
- dense
- density
- Depending
- depression
- depth
- Depths
- detail
- detailed
- details
- detected
- determines
- develop
- developed
- Development
- Devices
- dictates
- difference
- differences
- different
- Director
- disasters
- do
- Dont
- down
- drawing
- drive
- dropped
- during
- dynamic
- dynamics
- each
- earth
- easily
- eastern
- electrons
- energy
- Engineers
- enormous
- Enter
- environments
- Even
- events
- Every
- exactly
- example
- experiment
- experiments
- Explain
- Explains
- extra
- extreme
- fact
- far
- fast-moving
- few
- fewer
- Figure
- filled
- filling
- First
- five
- Flash
- florida
- fluctuated
- fluid
- Fluid dynamics
- FLUX
- follow
- following
- For
- Forecast
- form
- found
- France
- French
- from
- further
- future
- gauge
- generate
- geometry
- get
- gradients
- Ground
- had
- happen
- Have
- he
- height
- help
- helping
- here
- High
- higher
- Highlight
- highlights
- hiking
- his
- Hit
- Hits
- hitting
- hopes
- Horizontal
- HOT
- hour
- HOURS
- How
- However
- HTML
- HTTPS
- huge
- identical
- if
- image
- images
- Imaging
- important
- in
- include
- Including
- Incoming
- Increase
- Increases
- increasingly
- independent
- infamous
- information
- inside
- instance
- Institute
- interactions
- interesting
- interior
- internal
- into
- involve
- involving
- island
- Islands
- issue
- IT
- Italy
- ITS
- Japan
- Japan’s
- jpg
- July
- Know
- known
- Land
- large
- Last
- layer
- layers
- leading
- LEARN
- less
- levels
- Life
- light
- like
- Line
- linked
- Liquid
- little
- live
- located
- lower
- Lyon
- Main
- MAKES
- many
- many people
- map
- Mass
- matched
- materials
- max-width
- May..
- means
- measure
- measured
- measurement
- measurements
- mechanical
- medical
- medical imaging
- might
- minute
- minutes
- missing
- Mitigate
- model
- moment
- Monitor
- monitored
- monitoring
- more
- most
- mostly
- MOUNT
- Mountain
- moved
- movements
- much
- multiple
- namely
- National
- Natural
- Nature
- Near
- Need
- network
- Neural
- neural network
- neutrinos
- North
- now
- number
- numbers
- object
- objects
- observe
- occur
- ocean
- oceans
- of
- off
- on
- ONE
- only
- open
- or
- originating
- Other
- Others
- our
- out
- over
- Pacific
- parameter
- parking
- part
- particle
- particularly
- parts
- pass
- passed
- Passing
- past
- path
- People
- per
- Physics
- Physics World
- pioneered
- Pioneering
- planet
- Planets
- plato
- Plato Data Intelligence
- PlatoData
- points
- possible
- potential
- powerful
- predict
- predicted
- Prepare
- presence
- pressure
- primary
- probably
- probe
- process
- produce
- Produced
- produces
- producing
- project
- properties
- property
- protons
- provide
- provided
- provides
- providing
- radar
- RAIN
- rapidly
- rather
- reaching
- real
- real-time
- regions
- relatively
- reliable
- rely
- remains
- represent
- research
- researchers
- responsible
- result
- resulting
- Reveals
- reverse
- rising
- road
- rome
- same
- satellites
- says
- Scale
- scans
- SCI
- secondary
- see
- sensitive
- sensors
- September
- set
- several
- shallow
- Shape
- Short
- show
- Shows
- side
- Sights
- significant
- similar
- simply
- single
- small
- smaller
- So
- solid
- some
- something
- South
- Southern
- Space
- spaces
- Speaks
- speed
- speeds
- Spot
- square
- Steam
- Still
- Storm
- storms
- strength
- Strengthens
- strong
- stronger
- structure
- studies
- Study
- Studying
- subatomic particles
- such
- Summit
- Surface
- surrounded
- system
- Systems
- team
- techniques
- term
- than
- that
- The
- The Future
- the world
- their
- Them
- then
- There.
- therefore
- These
- they
- Third
- this
- those
- thought
- three
- Through
- throughout
- thumbnail
- Tide
- time
- times
- to
- together
- tokyo
- tomography
- took
- top
- Total
- towards
- Trackers
- trajectory
- travel
- tried
- true
- tunnel
- TURN
- Turning
- under
- understand
- understanding
- university
- University of Tokyo
- unlike
- us
- use
- used
- uses
- using
- vertical
- vertically
- very
- volcano
- Volcanoes
- volume
- want
- warm
- warning
- was
- Water
- waves
- Way..
- ways
- we
- Weather
- WELL
- were
- What
- What is
- when
- whether
- which
- while
- WHO
- whose
- why
- will
- wind
- winds
- with
- within
- world
- world’s
- worth
- would
- x-ray
- year
- you
- zephyrnet