Crypto Price Prediction: The current correction in the crypto market could revive the exhausted bullish momentum for the next leap
Crypto Price Prediction: The crypto market currently continues its corrective phase following its recent rally initiated in mid-October. This phase is crucial for buyers to gather momentum for the next upward move. While definitive signs of a continued uptrend are still forthcoming, the market participant can keep a watch on tokens like Stacks (STX), Injective (INJ), and Solana (SOL), which recently outperformed their peers.
advertisement
<!–
adClient.showBannerAd({
adUnitId: “856eec25-5bac-4623-9cc6-5827ff47c238”,
containerId: “market-banner-ad-mobile”
});
–>
The total value of the global cryptocurrency market now stands at $1.61 trillion, marking a slight decrease of 0.46% from the previous day. Additionally, the total volume of cryptocurrency transactions in the last 24 hours has reached $58.48 billion, reflecting a decrease of 8.26%.
Also Read: Marathon’s $178.6M Acquisition Supercharges Bitcoin Mining Power
Spotlight on Bitcoin Spot ETF
The Bitcoin spot ETF topic gains renewed interest as BlackRock, a major asset management firm, recently updated its S-1 filing with the Securities and Exchange Commission, introducing the ticker IBIT for its upcoming spot bitcoin ETF. This amendment also sheds light on the fund’s creation and redemption processes, a subject that has been at the forefront of recent discussions between BlackRock representatives and SEC officials. These developments continue to bolster the market sentiment toward the potential approval of Bitcoin spot ETF
Stacks Price Analysis: High Momentum Buying Hints a Rally to $2
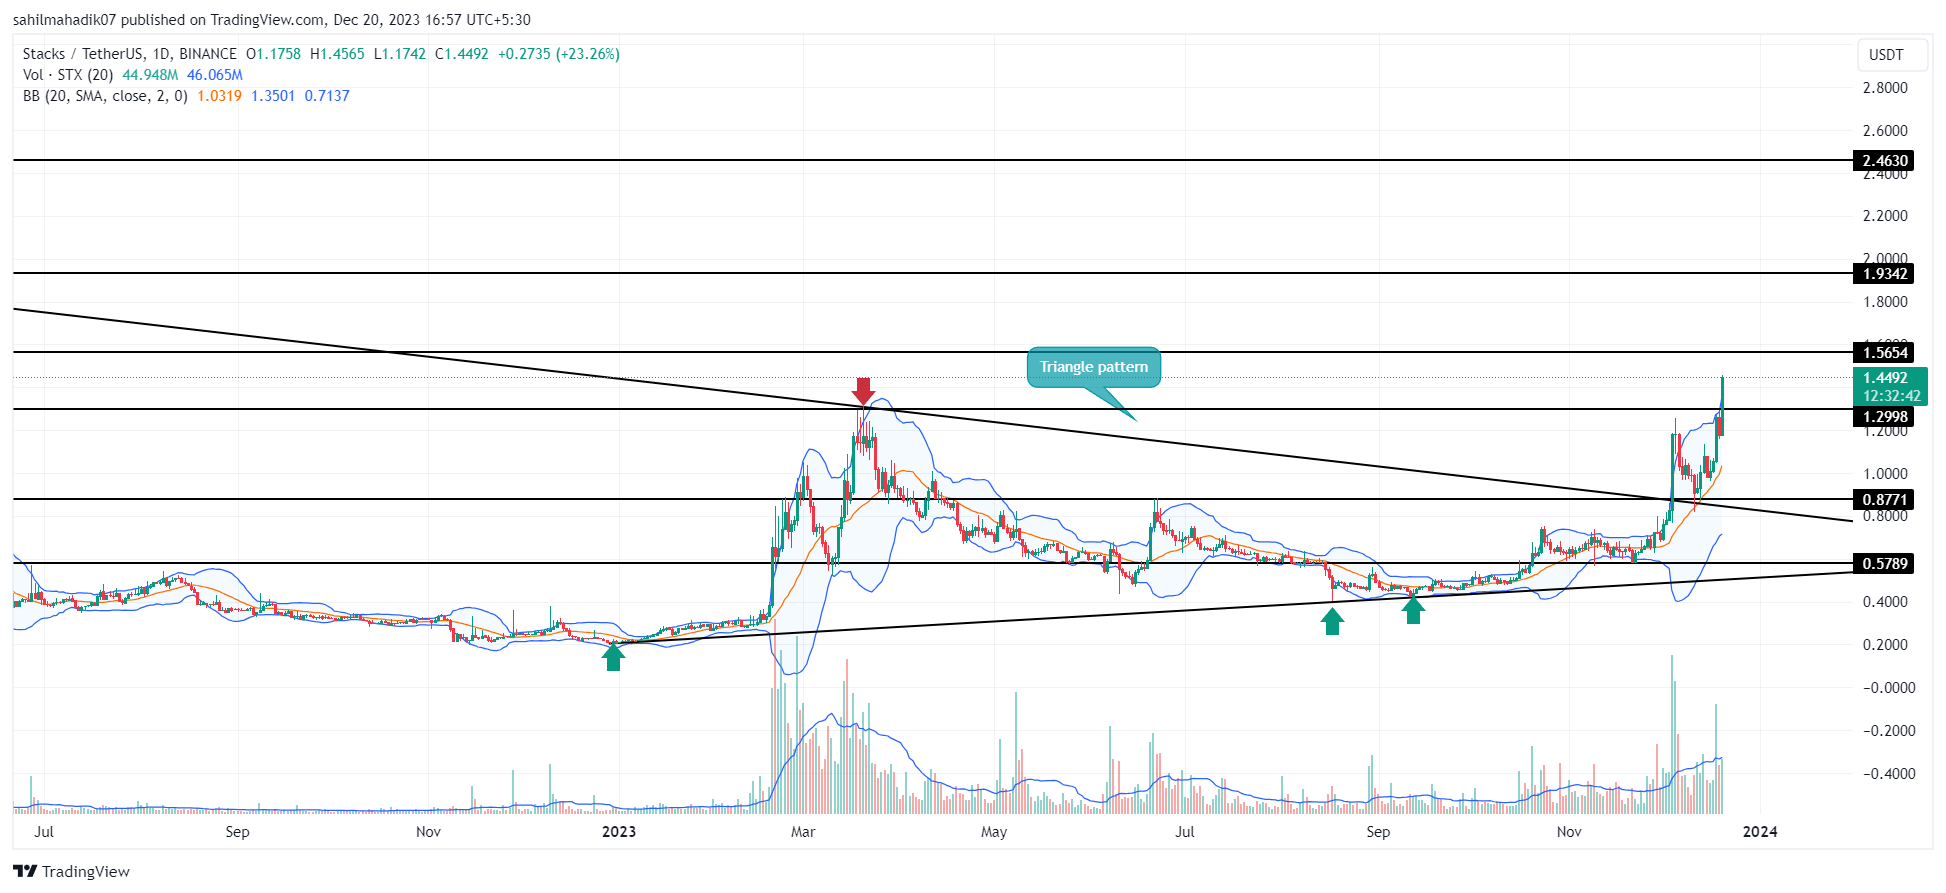
After enduring a prolonged 21-month period in a constraining triangle pattern, Stacks (STX) price finally witnessed a significant inflow on December 4th, breaking through the resistance trendline. This period was characterized by the price moving within two converging lines, indicating a lack of clear direction.
However, the recent breach of this pattern marks a pivotal shift in market sentiment, possibly signaling the start of a directional rally. Following a minor retest, the STX price has maintained a position above the $0.87 mark, spurring a remarkable 70% growth within just two weeks.
This rally coincides with a spike in network activity, especially with the increased minting of STX20 inscriptions. Currently trading at $1.42, STX price has breached the $1.3 resistance level, setting sights on potential targets of $1.56, $1.93, and eventually $2.4.
A steep upswing in the upper boundary of Bollinger band indicators indicates that buyers are dominating the asset.
Injective Price Analysis: Here’s Why INJ Price Recovery May Hit $50
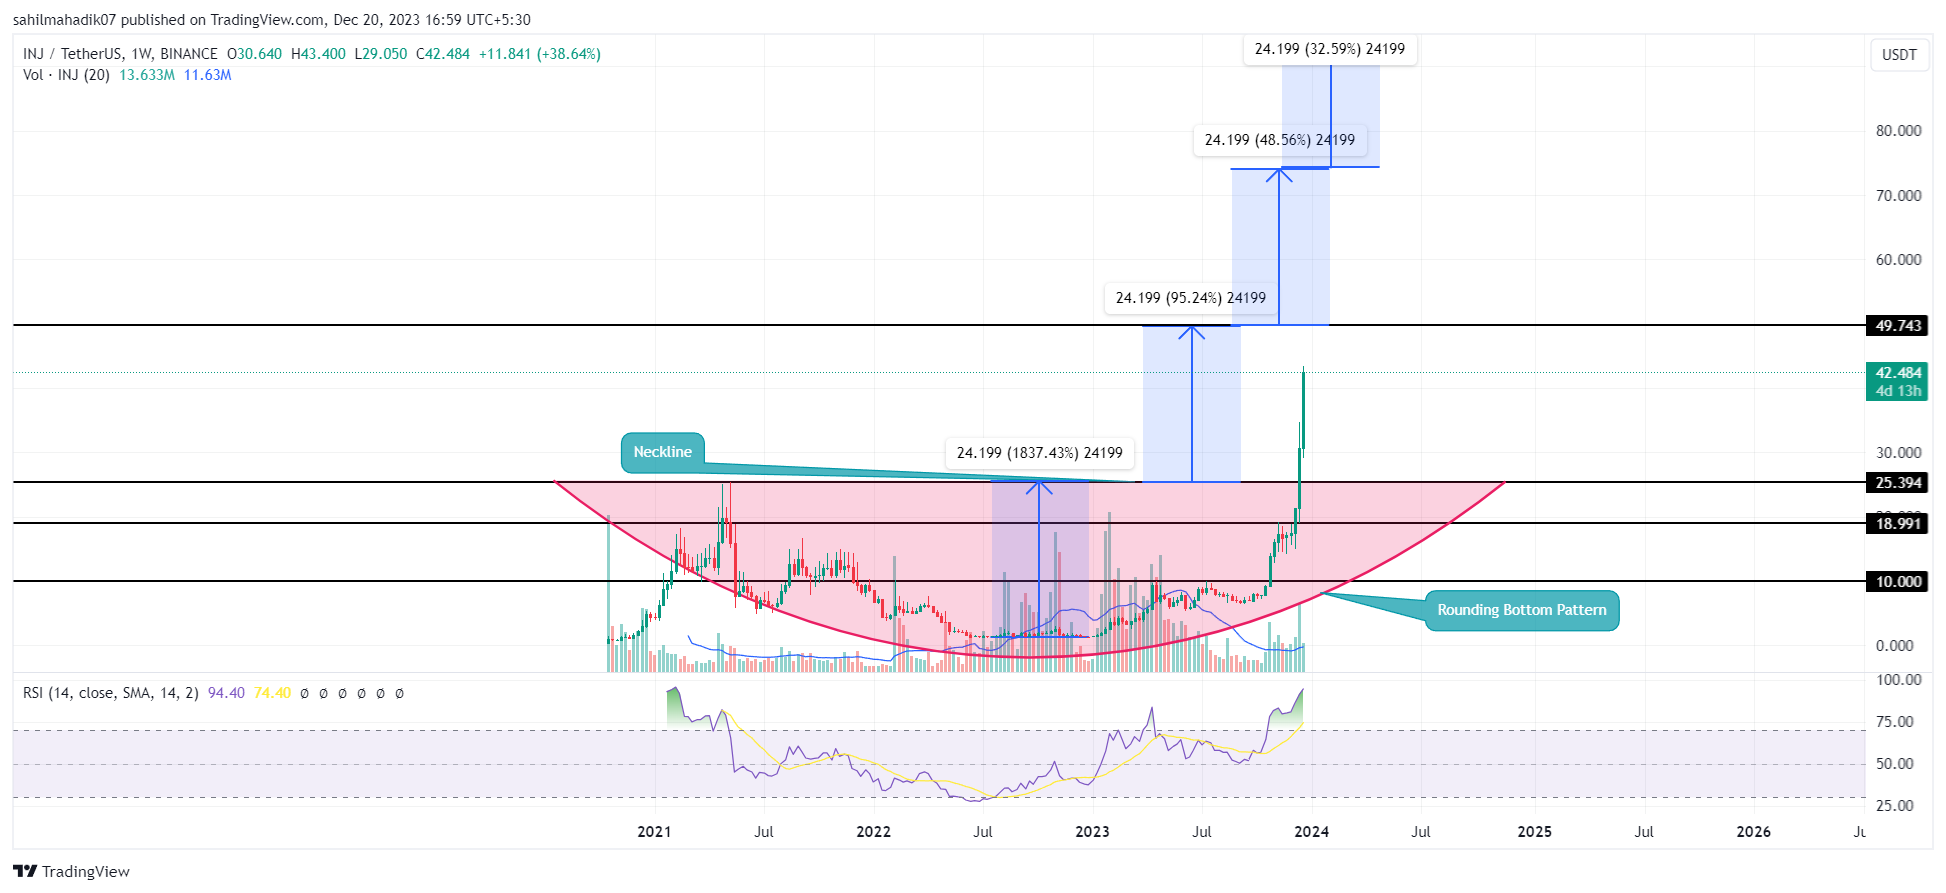
On December 13th, the Injective coin price gave a decisive breakout from the $25.4 neckline resistance of the rounding bottom pattern. Defying the current market uncertainty, this post-breakout rally has surged the price by 45% within a week to reach the current trading price of $42.36.
A rounding bottom pattern commonly spotted at the end of a bear market, provides an early signal of trend reversal. The current recovery back by increasing volume indicates no weakness in buyers’ conviction and a higher possibility of a further rally.
Thus, with sustained buying, the INJ price will likely surge to a new All-Time High of $50. However, under the influence of this bullish reversal pattern, the SOL price could witness a prolonged recovery to $74, followed by $95.8.
The momentum indicator RSI hitting a high of 88% in the daily chart accentuates the aggressive buying from traders
Solana Price Analysis: Wedge Pattern Breakout Will Surpass $100 Mark
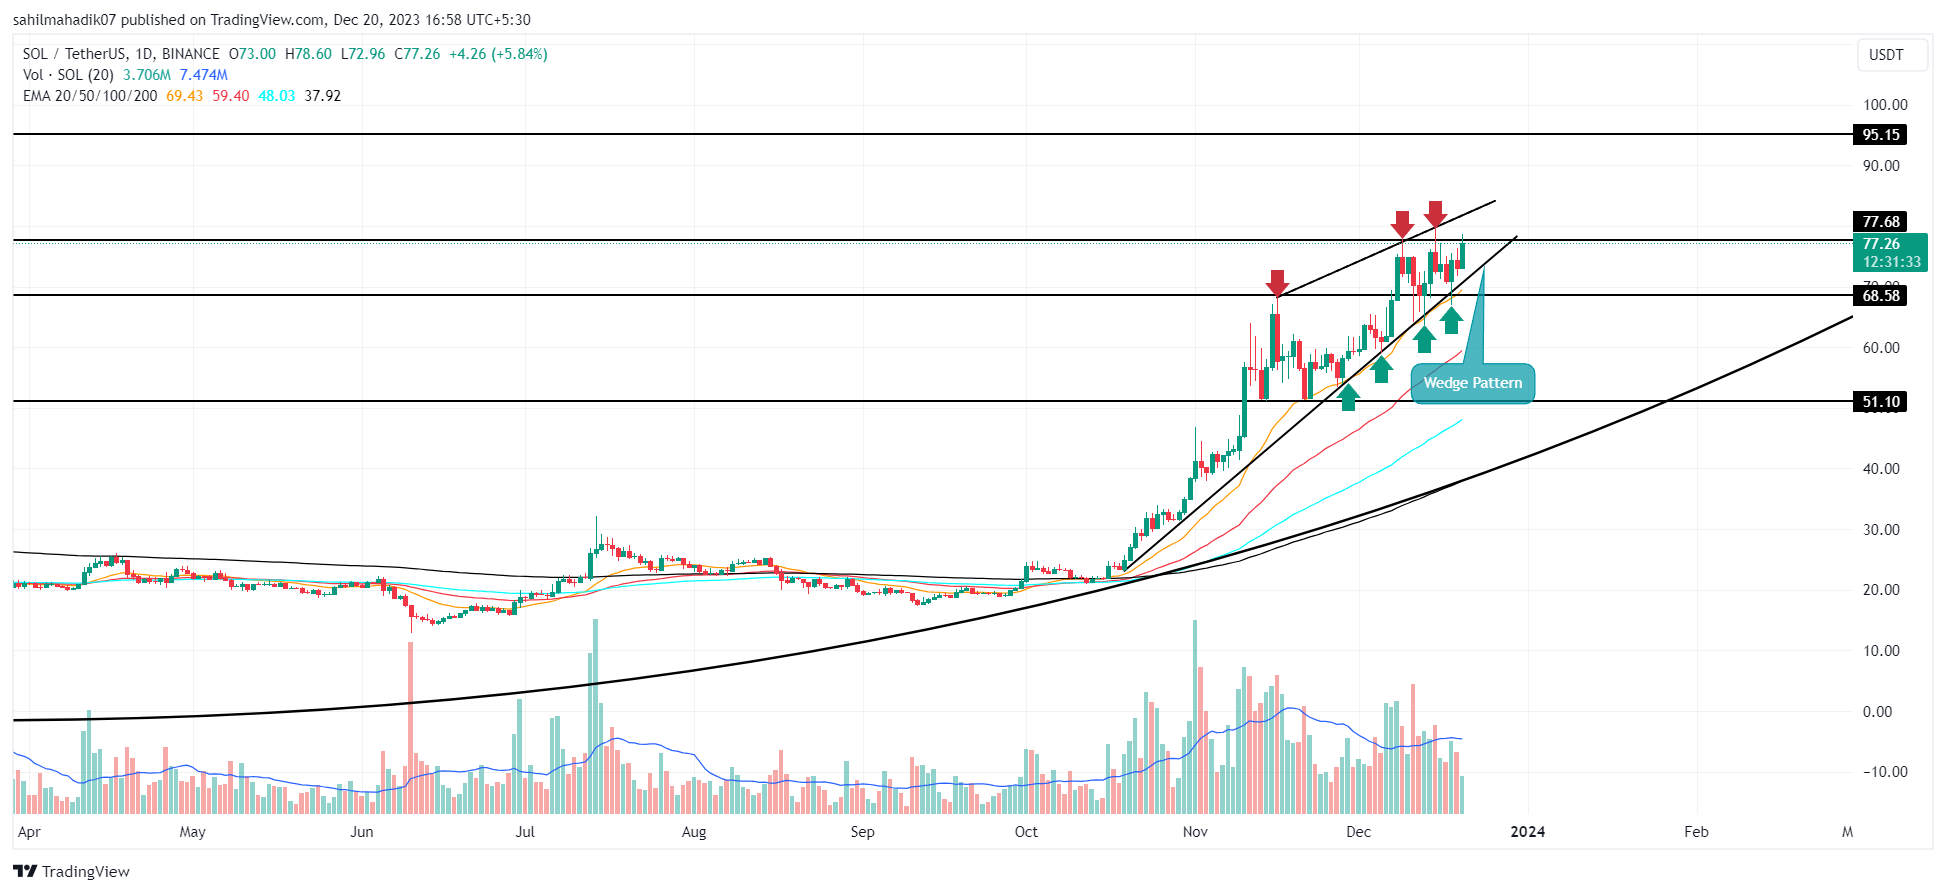
The ongoing recovery in Solana (SOL) price is evident from its steep ascending trendline, which has been a reliable support for buyers. From its October 13th low of $21.11, SOL has rallied impressively by 276%, reaching a new yearly high of $79.5.
Despite current market volatilities, this recovery is backed by increasing volume, indicating potential for further growth. Currently, the SOL price is forming a rising wedge pattern in the daily time frame chart, a development that traditionally suggests a possible correction.
However, the increasing demand for the Solana Saga phone, evident from its high resale value on platforms like eBay, is enhancing the network’s visibility and could positively influence the coin’s price.
advertisement
A breakout from this pattern’s upper trendline could propel the price toward targets of $95 and $120. The 20-day EMA slope continues to provide strong support, despite occasional pullbacks.
- SEO Powered Content & PR Distribution. Get Amplified Today.
- PlatoData.Network Vertical Generative Ai. Empower Yourself. Access Here.
- PlatoAiStream. Web3 Intelligence. Knowledge Amplified. Access Here.
- PlatoESG. Carbon, CleanTech, Energy, Environment, Solar, Waste Management. Access Here.
- PlatoHealth. Biotech and Clinical Trials Intelligence. Access Here.
- Source: https://coingape.com/markets/crypto-price-prediction-today-december-20-stx-inj-sol/
- :has
- :is
- 1
- 11
- 20
- 24
- 36
- 4th
- 72
- 8
- 87
- a
- above
- accentuates
- acquisition
- activity
- Ad
- Additionally
- aggressive
- also
- an
- analysis
- and
- approval
- ARE
- AS
- asset
- asset management
- At
- back
- backed
- BAND
- Bear
- Bear Market
- been
- between
- Billion
- Bitcoin
- Bitcoin ETF
- Bitcoin mining
- BlackRock
- bolster
- Bottom
- breach
- Breaking
- breakout
- Bullish
- buyers
- Buying
- by
- CAN
- characterized
- Chart
- clear
- coincides
- commission
- commonly
- content
- continue
- continued
- continues
- converging
- conviction
- could
- creation
- crucial
- crypto
- Crypto Market
- Crypto Price
- crypto price prediction
- cryptocurrency
- cryptocurrency market
- Current
- Currently
- daily
- day
- December
- decisive
- decrease
- definitive
- defying
- Demand
- Despite
- Development
- developments
- direction
- directional
- discussions
- dominating
- Early
- eBay
- end
- enduring
- enhancing
- especially
- ETF
- Ether (ETH)
- eventually
- evident
- exchange
- Exchange Commission
- Filing
- Finally
- Firm
- followed
- following
- For
- forefront
- forthcoming
- FRAME
- from
- further
- Gains
- gather
- gave
- Global
- Growth
- High
- higher
- hints
- Hit
- hitting
- HOURS
- However
- HTTPS
- in
- increased
- increasing
- indicates
- indicating
- Indicator
- Indicators
- influence
- initiated
- INJ
- INJ Price
- Injective
- interest
- introducing
- ITS
- just
- Keep
- Lack
- Last
- Leap
- Level
- light
- like
- likely
- lines
- Low
- major
- management
- mark
- Market
- market sentiment
- marking
- May..
- Mining
- minor
- Momentum
- move
- moving
- network
- New
- next
- no
- now
- occasional
- october
- of
- officials
- on
- ongoing
- outperformed
- participant
- Pattern
- peers
- period
- phase
- Platforms
- plato
- Plato Data Intelligence
- PlatoData
- plugin
- position
- positively
- possibility
- possible
- possibly
- potential
- prediction
- previous
- price
- Price Analysis
- Price Prediction
- processes
- Propel
- provide
- provides
- rally
- reach
- reached
- reaching
- Read
- recent
- recently
- recovery
- redemption
- reflecting
- reliable
- remarkable
- renewed
- Representatives
- Resistance
- Reversal
- Revive
- rising
- rounding
- saga
- SEC
- Securities
- Securities and Exchange Commission
- sentiment
- setting
- shift
- Sights
- Signal
- significant
- Signs
- Slope
- SOL
- SOL Price
- Solana
- Solana (SOL)
- Solana Price
- solana price analysis
- spike
- Spot
- Spot Bitcoin Etf
- Stacks
- stands
- start
- Still
- strong
- STX
- subject
- Suggests
- support
- surge
- Surged
- surpass
- sustained
- targets
- that
- The
- their
- These
- this
- Through
- ticker
- time
- to
- Tokens
- topic
- Total
- toward
- Trading
- TradingView
- traditionally
- Transactions
- Trend
- Trillion
- two
- Uncertainty
- under
- upcoming
- updated
- uptrend
- upward
- value
- visibility
- volume
- was
- Watch
- weakness
- week
- Weeks
- which
- while
- why
- will
- with
- within
- witness
- witnessed
- yearly
- zephyrnet