Image by Author
While analyzing the data, the thing in our mind is to find hidden patterns and extract meaningful insights. Let’s enter into the new category of ML-based learning, i.e., Unsupervised learning, in which one of the powerful algorithms to solve the clustering tasks is the K-Means clustering algorithm which revolutionizes data understanding.
K-Means has become a useful algorithm in machine learning and data mining applications. In this article, we will deep dive into the workings of K-Means, its implementation using Python, and exploring its principles, applications, etc. So, let's start the journey to unlock the secret patterns and harness the potential of the K-Means clustering algorithm.
The K-Means algorithm is used to solve the clustering problems which belong to the Unsupervised learning class. With the help of this algorithm, we can group the number of observations into K clusters.
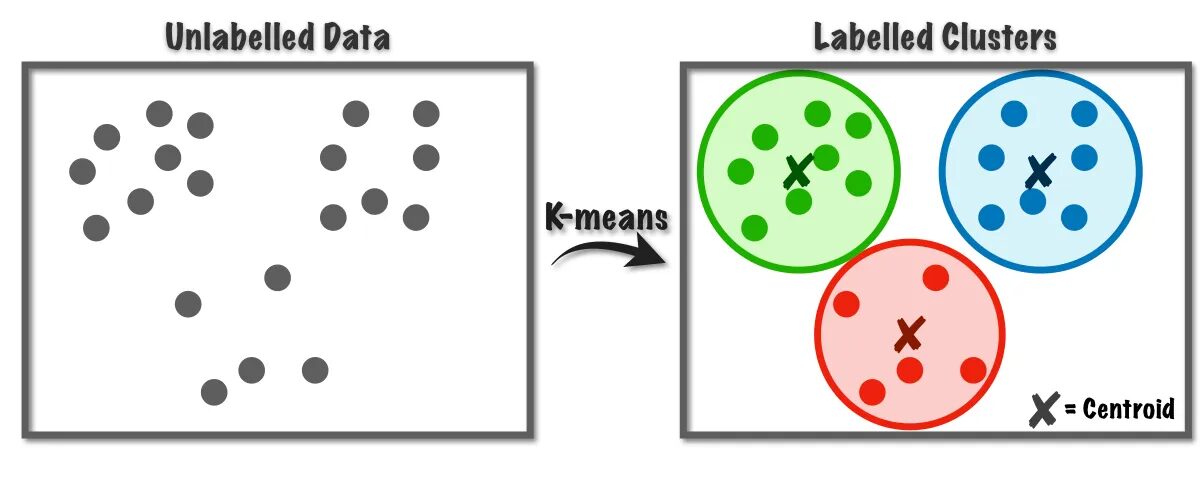
Fig.1 K-Means Algorithm Working | Image from Towards Data Science
This algorithm internally uses vector quantization, through which we can assign each observation in the dataset to the cluster with the minimum distance, which is the prototype of the clustering algorithm. This clustering algorithm is commonly used in Data mining and machine learning for data partitioning into K clusters based on similarity metrics. Therefore, in this algorithm, we have to minimize the sum of squares distance between the observations and their corresponding centroids, which eventually results in distinct and homogeneous clusters.
Applications of K-means Clustering
Here are some of the standard applications of this algorithm. The K-means algorithm is a commonly used technique in industrial use cases for solving clustering-related problems.
- Customer Segmentation: K-means clustering can segment different customers based on their interests. It can be applied to banking, telecom, e-commerce, sports, advertising, sales, etc.
- Document Clustering: In this technique, we will club similar documents from a set of documents, resulting in similar documents in the same clusters.
- Recommendation Engines: Sometimes, K-means clustering can be used to create recommendation systems. For Example, you want to recommend songs to your friends. You can look at the songs liked by that person and then use clustering to find similar songs and recommend the most similar ones.
There are many more applications that I’m sure you have already thought of, which you probably share in the comments section below this article.
In this section, we will start implementing the K-Means algorithm on one of the datasets using Python, mainly used in Data Science projects.
1. Import necessary Libraries and Dependencies
First, Let’s import the python libraries we use to implement the K-means algorithm, including NumPy, Pandas, Seaborn, Marplotlib, etc.
import numpy as np
import pandas as pd
import matplotlib.pyplot as plt
import seaborn as sb
2. Load and Analyze the Dataset
In this step, we will load the student dataset by storing that in the Pandas dataframe. To download the dataset, you can refer to the link here.
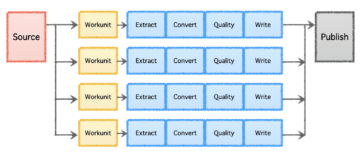
The complete pipeline of the problem is shown below:
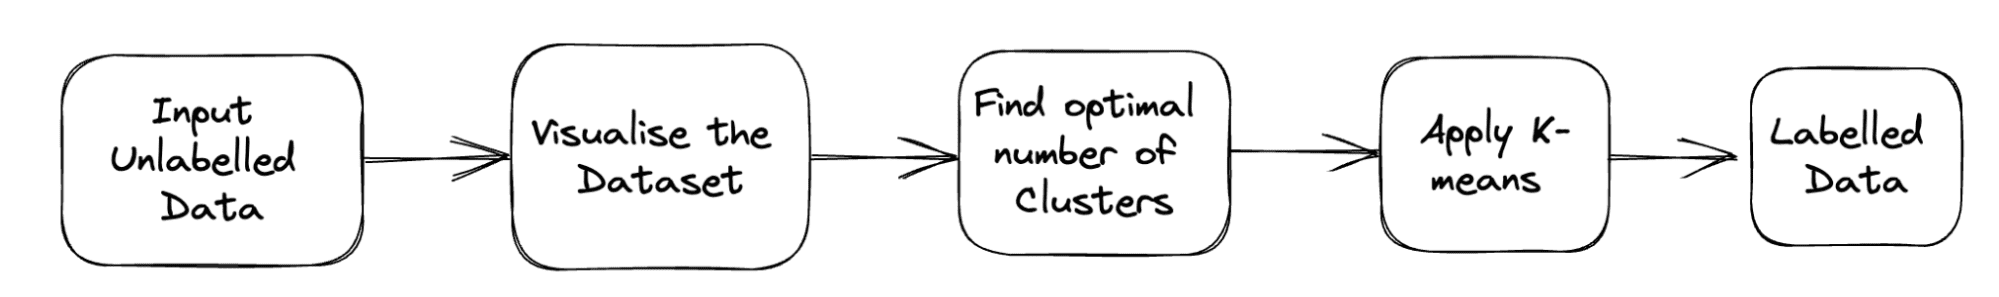
Fig. 2 Project Pipeline | Image by Author
df = pd.read_csv('student_clustering.csv')
print("The shape of data is",df.shape)
df.head()
3. Scatter Plot of the Dataset
Now comes the step of modeling is to visualize the data, so we use matplotlib to draw the scatter plot to check how the clustering algorithm works and create different clusters.
# Scatter plot of the dataset
import matplotlib.pyplot as plt
plt.scatter(df['cgpa'],df['iq'])
Output:
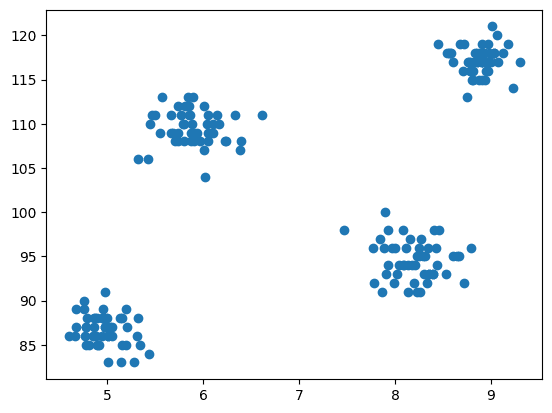
Fig.3 Scatter Plot | Image by Author
4. Import the K-Means from the Cluster Class of Scikit-learn
Now, as we have to implement the K-Means clustering, we first import the cluster class, and then we have KMeans as the module of that class.
from sklearn.cluster import KMeans5. Finding the Optimal Value of K using the Elbow Method
In this step, we will find the optimal value of K, one of the hyperparameters, while implementing the algorithm. The K value signifies how many clusters we must create for our dataset. Finding this value intuitively is not possible, so to find the optimal value, we are going to create a plot between WCSS(within-cluster-sum-of-squares) and different K-values, and we have to choose that K, which gives us the minimum value of WCSS.
# create an empty list for store residuals
wcss = [] for i in range(1,11): # create an object of K-Means class km = KMeans(n_clusters=i) # pass the dataframe to fit the algorithm km.fit_predict(df) # append inertia value to wcss list wcss.append(km.inertia_)
Now, let’s plot the elbow plot to find the optimal value of K.
# Plot of WCSS vs. K to check the optimal value of K
plt.plot(range(1,11),wcss)
Output:
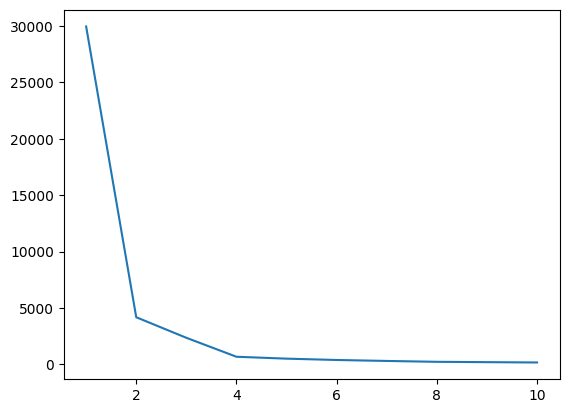
Fig.4 Elbow Plot | Image by Author
From the above elbow plot, we can see at K=4; there is a dip in the value of WCSS, which means if we use the optimal value as 4, in that case, the clustering will give you a good performance.
6. Fit the K-Means Algorithm with the Optimal value of K
We are done with finding the optimal value of K. Now, let’s do the modeling where we will create an X array that stores the complete dataset having all the features. There is no need to separate the target and feature vector here, as it is an unsupervised problem. After that, we will create an object of KMeans class with a selected K value and then fit that on the dataset provided. Finally, we print the y_means, which indicates the means of different clusters formed.
X = df.iloc[:,:].values # complete data is used for model building
km = KMeans(n_clusters=4)
y_means = km.fit_predict(X)
y_means
7. Check the Cluster Assignment of each Category
Let’s check which all points in the dataset belong to which cluster.
X[y_means == 3,1]
Till now, for centroid initialization, we have used the K-Means++ strategy, now, let’s initialize the random centroids instead of K-Means++ and compare the results by following the same process.
km_new = KMeans(n_clusters=4, init='random')
y_means_new = km_new.fit_predict(X)
y_means_new
Check how many values match.
sum(y_means == y_means_new)8. Visualizing the Clusters
To visualize each cluster, we plot them on the axes and assign different colors through which we can easily see 4 clusters formed.
plt.scatter(X[y_means == 0,0],X[y_means == 0,1],color='blue')
plt.scatter(X[y_means == 1,0],X[y_means == 1,1],color='red') plt.scatter(X[y_means == 2,0],X[y_means == 2,1],color='green') plt.scatter(X[y_means == 3,0],X[y_means == 3,1],color='yellow')
Output:
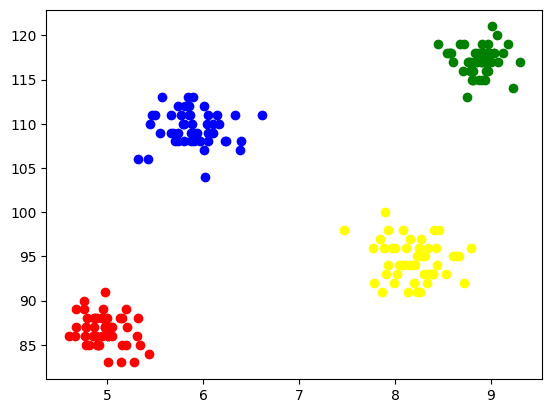
Fig. 5 Visualization of Clusters Formed | Image by Author
9. K-Means on 3D-Data
As the previous dataset has 2 columns, we have a 2-D problem. Now, we will utilize the same set of steps for a 3-D problem and try to analyze the code reproducibility for n-dimensional data.
# Create a synthetic dataset from sklearn
from sklearn.datasets import make_blobs # make synthetic dataset
centroids = [(-5,-5,5),(5,5,-5),(3.5,-2.5,4),(-2.5,2.5,-4)]
cluster_std = [1,1,1,1]
X,y = make_blobs(n_samples=200,cluster_std=cluster_std,centers=centroids,n_features=3,random_state=1)
# Scatter plot of the dataset
import plotly.express as px
fig = px.scatter_3d(x=X[:,0], y=X[:,1], z=X[:,2])
fig.show()
Output:
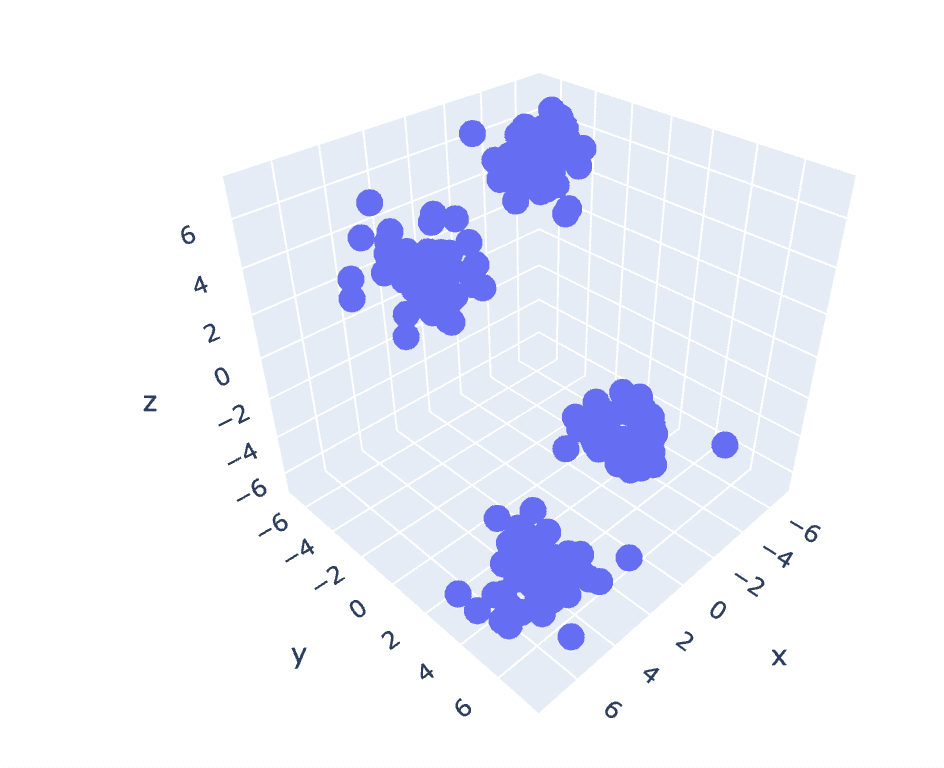
Fig. 6 Scatter Plot of 3-D Dataset | Image by Author
wcss = []
for i in range(1,21): km = KMeans(n_clusters=i) km.fit_predict(X) wcss.append(km.inertia_) plt.plot(range(1,21),wcss)
Output:

Fig.7 Elbow Plot | Image by Author
# Fit the K-Means algorithm with the optimal value of K
km = KMeans(n_clusters=4)
y_pred = km.fit_predict(X)
# Analyse the different clusters formed
df = pd.DataFrame()
df['col1'] = X[:,0]
df['col2'] = X[:,1]
df['col3'] = X[:,2]
df['label'] = y_pred fig = px.scatter_3d(df,x='col1', y='col2', z='col3',color='label')
fig.show()
Output:
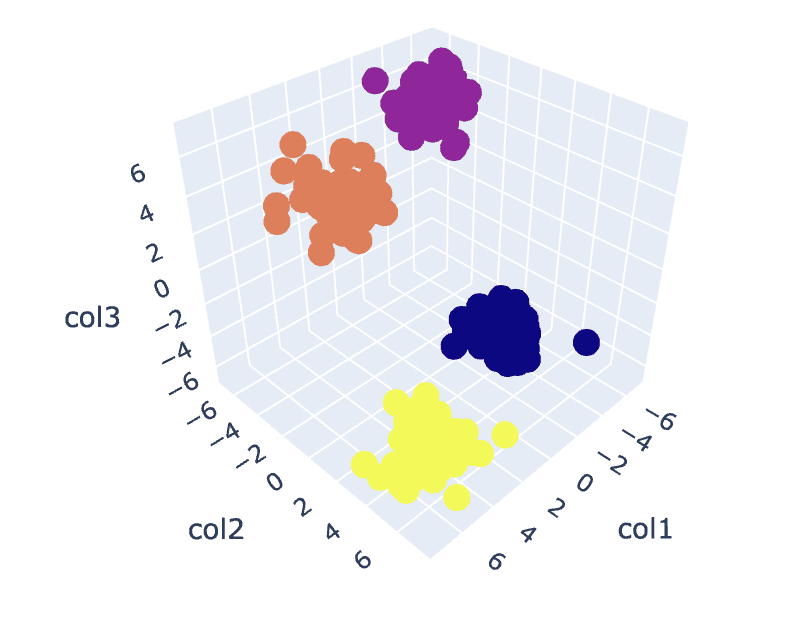
Fig.8. Clusters Visualization | Image by Author
You can find the complete code here - Colab Notebook
This completes our discussion. We have discussed the K-Means working, implementation, and applications. In conclusion, implementing the clustering tasks is a widely used algorithm from the class of unsupervised learning that provides a simple and intuitive approach to grouping the observations of a dataset. The main strength of this algorithm is to divide the observations into multiple sets based on the selected similarity metrics with the help of the user who is implementing the algorithm.
However, based on the selection of centroids in the first step, our algorithm behaves differently and converges to local or global optima. Therefore, selecting the number of clusters to implement the algorithm, preprocessing the data, handling outliers, etc., is crucial to obtain good results. But if we observe the other side of this algorithm behind the limitations, K-Means is a helpful technique for exploratory data analysis and pattern recognition in various fields.
Aryan Garg is a B.Tech. Electrical Engineering student, currently in the final year of his undergrad. His interest lies in the field of Web Development and Machine Learning. He have pursued this interest and am eager to work more in these directions.
- SEO Powered Content & PR Distribution. Get Amplified Today.
- PlatoData.Network Vertical Generative Ai. Empower Yourself. Access Here.
- PlatoAiStream. Web3 Intelligence. Knowledge Amplified. Access Here.
- PlatoESG. Automotive / EVs, Carbon, CleanTech, Energy, Environment, Solar, Waste Management. Access Here.
- BlockOffsets. Modernizing Environmental Offset Ownership. Access Here.
- Source: https://www.kdnuggets.com/2023/07/clustering-unleashed-understanding-kmeans-clustering.html?utm_source=rss&utm_medium=rss&utm_campaign=clustering-unleashed-understanding-k-means-clustering
- :has
- :is
- :not
- :where
- 1
- 10
- 11
- 13
- 16
- 25
- 28
- 7
- 8
- 9
- a
- above
- Advertising
- After
- algorithm
- algorithms
- All
- already
- am
- an
- analyse
- analysis
- analyze
- analyzing
- and
- applications
- applied
- approach
- ARE
- Array
- article
- AS
- At
- AXES
- b
- Banking
- based
- BE
- become
- behind
- below
- between
- Blue
- Building
- but
- by
- CAN
- case
- cases
- Category
- check
- Choose
- class
- club
- Cluster
- clustering
- code
- Columns
- comes
- comments
- commonly
- compare
- complete
- Completes
- conclusion
- Corresponding
- create
- crucial
- Currently
- customer
- Customers
- data
- data analysis
- data mining
- data science
- datasets
- deep
- deep dive
- Development
- different
- Dip
- directions
- discussed
- discussion
- distance
- distinct
- do
- document
- documents
- done
- download
- draw
- e
- e-commerce
- each
- eager
- easily
- electrical engineering
- Engineering
- Engines
- Enter
- etc
- eventually
- example
- Exploratory Data Analysis
- Exploring
- express
- extract
- Feature
- Features
- field
- Fields
- Fig
- final
- Finally
- Find
- finding
- First
- fit
- following
- For
- formed
- friends
- from
- Give
- gives
- Global
- going
- good
- Green
- Group
- Handling
- harness
- Have
- having
- he
- help
- helpful
- here
- Hidden
- his
- How
- HTTPS
- i
- if
- image
- implement
- implementation
- implementing
- import
- in
- Including
- indicates
- industrial
- inertia
- insights
- instead
- interest
- interests
- internally
- into
- intuitive
- IT
- ITS
- journey
- jpg
- KDnuggets
- Label
- learning
- libraries
- lies
- limitations
- LINK
- List
- load
- local
- Look
- machine
- machine learning
- Main
- mainly
- make
- many
- Match
- matplotlib
- meaningful
- means
- Metrics
- mind
- minimum
- Mining
- model
- modeling
- module
- more
- most
- multiple
- must
- necessary
- Need
- New
- no
- now
- number
- numpy
- object
- observe
- obtain
- of
- on
- ONE
- ones
- optimal
- or
- Other
- our
- pandas
- pass
- Pattern
- patterns
- performance
- person
- pipeline
- plato
- Plato Data Intelligence
- PlatoData
- points
- possible
- potential
- powerful
- previous
- principles
- probably
- Problem
- problems
- process
- project
- projects
- prototype
- provided
- provides
- Python
- random
- recognition
- recommend
- Recommendation
- Red
- research
- resulting
- Results
- revolutionizes
- s
- sales
- same
- Science
- seaborn
- Secret
- Section
- see
- segment
- segmentation
- selected
- selecting
- selection
- separate
- set
- Sets
- Shape
- Share
- shown
- side
- signifies
- similar
- Simple
- So
- SOLVE
- Solving
- some
- Sports
- squares
- standard
- start
- Step
- Steps
- store
- stores
- Strategy
- strength
- Student
- sure
- synthetic
- Systems
- Target
- tasks
- tech
- telecom
- that
- The
- their
- Them
- then
- There.
- therefore
- These
- thing
- this
- thought
- Through
- to
- try
- understanding
- unleashed
- unlock
- unsupervised learning
- us
- use
- used
- User
- uses
- using
- utilize
- value
- Values
- various
- visualization
- vs
- want
- we
- web
- Web development
- which
- while
- WHO
- widely
- will
- with
- Work
- working
- workings
- works
- X
- year
- yellow
- you
- Your
- zephyrnet