Cardano (ADA) is recently showing signs of a potential trend reversal. But after staging an impressive 48% rally from its low in June, the ADA price faces crucial hurdles to solidify its bullish stance.
Cardano (ADA) Price Analysis
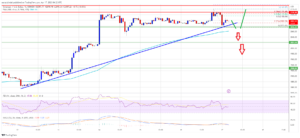
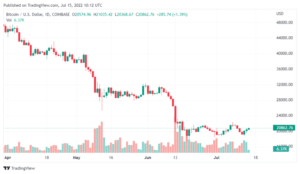
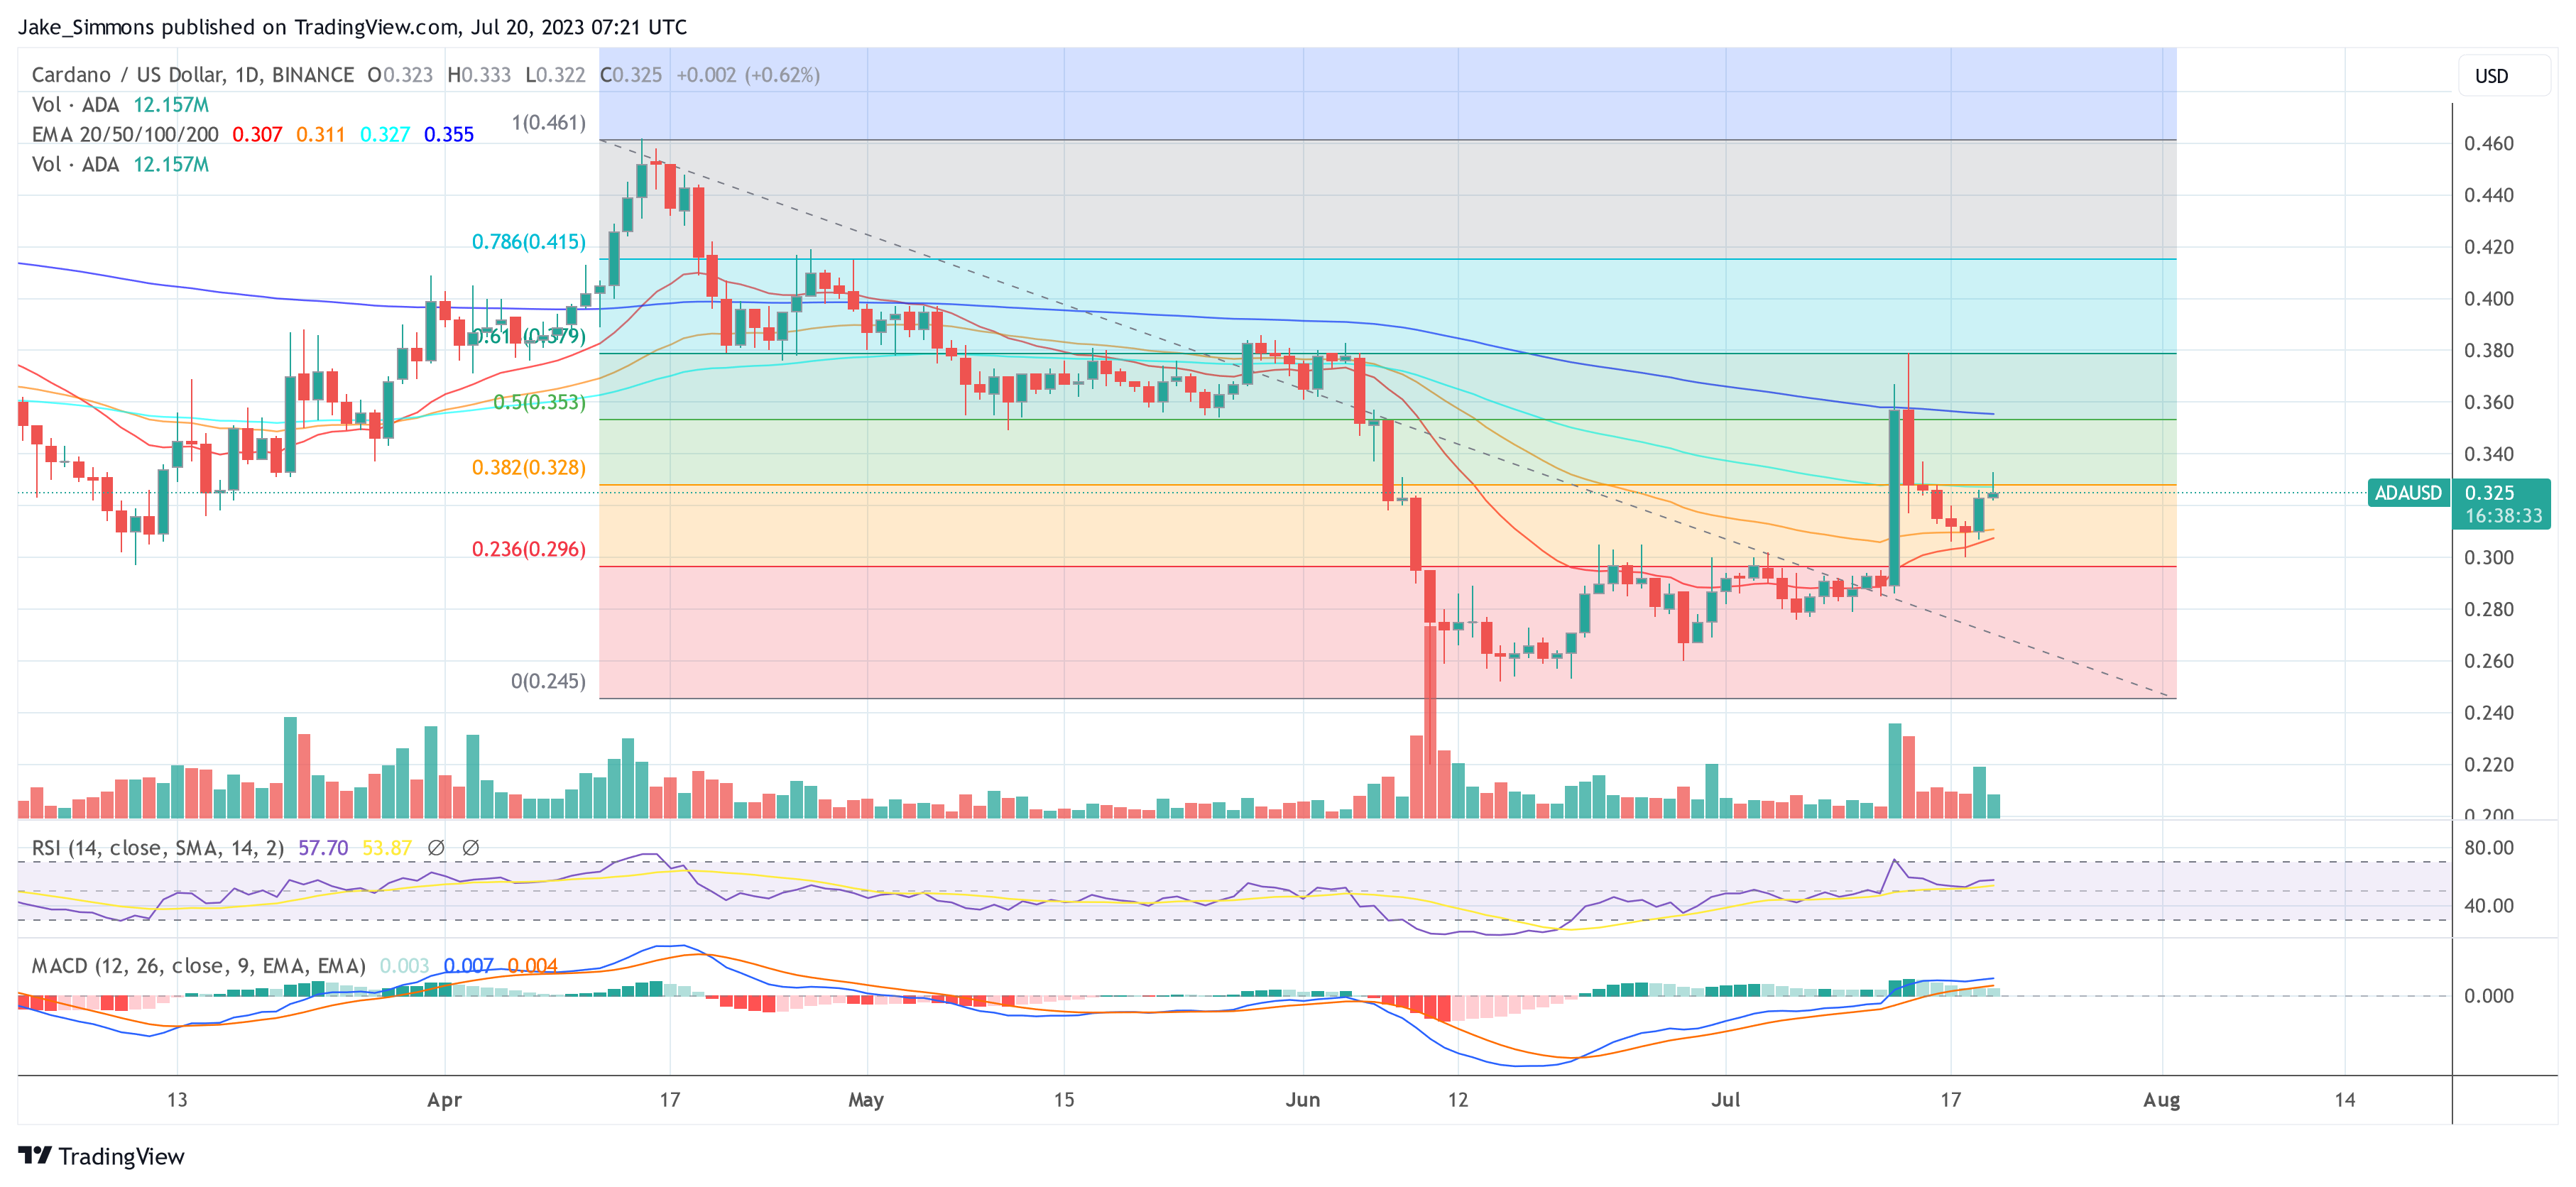
Cardano enthusiasts have had their patience tested as the ADA price navigated through a series of ups and downs. Following a dip to $0.221 in June, Cardano embarked on an impressive 48% rally, fueled in part by positive sentiment stemming from the Ripple legal dispute with the SEC. During this period, the price surged to the 61.8% Fibonacci retracement level, sparking excitement among the bulls.
However, enthusiasm soon waned as the buy side struggled to stabilize above the 200-day EMA (blue). ADA subsequently corrected back to the crucial breakout level at $0.30, where the bulls regained their footing and lifted the price above the EMA50 (orange).
Bullish ADA Price Targets
For the short-term outlook to brighten further, ADA needs to overcome some important hurdles. The first key resistance is at the 38.2% Fibonacci retracement level, sitting at $0.328. A successful push beyond this level could open the path for an attack towards the $0.355 mark, where the 200-day EMA poses its most significant challenge.
However, an impulse from the broader crypto market, Bitcoin or also more positive news from the Ripple legal battle with the SEC is probably required for this. Only when the buy side can recapture the 200-day EMA on the daily closing price, the probability for a near-term trend reversal increases significantly.
A sustained break of the 61.8% Fibonacci retracement level at $0.38 is essential for a true bullish trend reversal. This milestone would increase the probability of revisiting the previous week’s high. For this, a breakout above the critical zone between $0.361 and $0.38 would be a trend reversal for the bulls.
If successful, the ADA price could eye the local high of $0.399. Then, the next target becomes the 78.6% Fibonacci retracement level at $0.415. Here, the fate of Cardano’s upward trajectory will be decided, with a potential push towards the April 15 annual high of $0.463. However, prudent investors should be prepared to take profits if ADA approaches this level.
Beyond this point, an ongoing bullish scenario opens up possibilities to target the local high of September 10, 2022, at $0.524. And if the bullish momentum remains robust, the high of August 2022 at $0.590 could become the next objective.
Bearish Price Targets
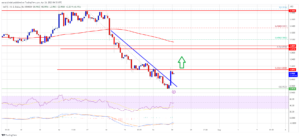
While the upward trend is evident, a sustainable market structure change is not yet confirmed. The bears showed their presence on July 15, holding the ADA price below the “bear market line” represented by the 200-day EMA. However, the recent 21% correction saw the buy side reclaim control, at least for the time being.
To initiate another sell-off, the bears need a daily close below the 50-day EMA at $0.311. Until that happens, the bulls can feel relatively secure in their position. A failure to do so may lead to a retest of the support zone between $0.30 and the 23.6% Fibonacci retracement at $0.296, with further correction potential towards the $0.266 support area.
The Relative Strength Index (RSI) initially surged to 72 but has since settled into the neutral zone at 54. Generating a fresh buy signal will be crucial for a massive price increase, as an overheated RSI typically accompanies substantial rallies. On a positive note, the MACD indicator triggered a new long signal by crossing above the 0-line, adding to the short-term optimism.
Featured image from iStock, chart from TradingView.com
- SEO Powered Content & PR Distribution. Get Amplified Today.
- PlatoData.Network Vertical Generative Ai. Empower Yourself. Access Here.
- PlatoAiStream. Web3 Intelligence. Knowledge Amplified. Access Here.
- PlatoESG. Automotive / EVs, Carbon, CleanTech, Energy, Environment, Solar, Waste Management. Access Here.
- BlockOffsets. Modernizing Environmental Offset Ownership. Access Here.
- Source: https://www.newsbtc.com/news/cardano/cardano-ada-price-action-potential-trend-reversal/
- :has
- :is
- :not
- :where
- $UP
- 10
- 15%
- 2%
- 2022
- 23
- 30
- 72
- a
- above
- Action
- ADA
- ada price
- ADAUSD
- adding
- After
- also
- among
- an
- and
- annual
- Another
- approaches
- April
- AREA
- AS
- At
- attack
- AUGUST
- back
- Battle
- BE
- Bears
- become
- becomes
- being
- below
- between
- Beyond
- Bitcoin
- Blue
- Break
- breakout
- broader
- Bullish
- Bulls
- but
- buy
- by
- CAN
- Cardano
- Cardano (ADA)
- cardano ada price
- challenge
- change
- Chart
- Close
- closing
- CONFIRMED
- control
- corrected
- could
- critical
- crucial
- crypto
- Crypto Market
- daily
- decided
- Dip
- Dispute
- do
- downs
- during
- EMA
- enthusiasm
- enthusiasts
- essential
- evident
- Excitement
- eye
- faces
- Failure
- fate
- feel
- Fibonacci
- First
- following
- For
- fresh
- from
- fueled
- further
- generating
- had
- happens
- Have
- here
- High
- holding
- However
- HTTPS
- Hurdles
- if
- image
- important
- impressive
- in
- Increase
- Increases
- index
- Indicator
- initially
- initiate
- into
- Investors
- ITS
- July
- July 15
- june
- Key
- key resistance
- lead
- least
- Legal
- Level
- Lifted
- local
- Long
- Low
- MACD
- mark
- Market
- Market Structure
- massive
- max-width
- May..
- milestone
- Momentum
- more
- most
- Need
- needs
- Neutral
- New
- news
- NewsBTC
- next
- objective
- of
- on
- ongoing
- only
- open
- opens
- Optimism
- or
- Orange
- Outlook
- Overcome
- part
- path
- Patience
- pending
- period
- plato
- Plato Data Intelligence
- PlatoData
- Point
- points
- poses
- position
- positive
- possibilities
- potential
- prepared
- presence
- previous
- price
- PRICE ACTION
- Price Increase
- probability
- probably
- profits
- Push
- rallies
- rally
- recent
- recently
- relative
- relative strength index
- Relative Strength Index (RSI)
- relatively
- remains
- represented
- required
- Resistance
- retracement
- Reversal
- Ripple
- robust
- rsi
- saw
- scenario
- SEC
- secure
- sell-off
- sentiment
- September
- Series
- Settled
- short-term
- should
- showed
- showing
- side
- Signal
- significant
- significantly
- Signs
- since
- Sitting
- So
- some
- Soon
- Source
- stabilize
- staging
- strength
- structure
- Subsequently
- substantial
- successful
- support
- Surged
- sustainable
- sustained
- Take
- Target
- tested
- that
- The
- their
- then
- this
- Through
- time
- to
- towards
- TradingView
- trajectory
- Trend
- triggered
- true
- typically
- until
- UPS
- upward
- when
- will
- with
- would
- yet
- zephyrnet