Recently I’ve been reviewing studies related to hydrogen trucking, as it’s one of the few places where serious transportation research organizations still hold out hope for the energy carrier. I’ve looked at studies from multiple countries in Europe and North America back as far as 2010 now.
Most recently I’ve been part of the peer-review group of a European study doing another total cost of ownership simulation across hydrogen, battery electric and electric road systems, biofuels and diesel as the baseline. One thing that leapt out at me was that assumptions of maintenance of hydrogen vehicles appeared too low, with the study showing it would barely be more than battery electric.
I was aware of anecdotal evidence of higher fleet maintenance costs and first principles related to high pressures, extreme temperature ranges, air purity requirements and the characteristics of hydrogen suggested it should be more as well. So I looked for more data.
California fleet maintenance reports showed that hydrogen fuel cell buses across three transit organizations and a combined eight years of operation had maintenance costs over 50% higher than diesel buses on average for the same distances traveled. While researching and writing that up, I briefly wondered whether the complex refueling stations had similar maintenance challenges, but left that for another day. Today is apparently that day.
After publication, a chemical engineer acquaintance told me that maintenance costs were usually presented in total cost of ownership studies as being 3% of capital expenditure per year, but that quotes from refuelers he had received while considering a 350 atmospheric pressure refueling solution were indicating that it should be 10% of capital expenditures instead. Unfortunately, he wasn’t able to share them.
Sure enough, when I went to look at the International Council on Clean Transportation’s assumptions about hydrogen refueling stations, I found this:
We assume the annual fixed operational cost of maintenance and labor to be 4% of the system capital cost, similar to previous studies (Brynolf et al., 2018; Matute et al., 2019).
Anecdotally it appears that this is another thumb on the scale that benefits hydrogen truck refueling total costs of ownership that is systemic. But is it actually true? Is there data that is available that the ICCT and others should be considering?
It took a while to track down a source, but yet again California and the US NREL came through. I found a 2022 report, Next Generation Hydrogen Station Analysis, presented as part of the DOE Hydrogen Program at an Annual Merit Review and Peer Evaluation Meeting. It included six years of maintenance data on the fuel cell pumps in the state. The data ended after Q2 of 2021, but that was sufficient to see an increase post COVID and of course there was pre-COVID data.
The data covered 55 retail stations, mostly for light vehicles, pumping hydrogen at 700 atmospheres into Toyota Mirais, Hyundai Nexos and the like. Many have only a single pump because there’s no demand for more. There were also a couple of heavy vehicle stations in there, but they weren’t split out separately, which is unfortunate as the added complexity undoubtedly adds to the maintenance costs. 110 new stations that the state intended to build never materialized, and the current count remains 55 a couple of years later.
Why added complexity? Well, refueling pumps for light vehicles are slow, dispensing on average 0.93 kg of hydrogen per minute per the NREL report on actual rates, meaning it takes about five minutes to fill up a Toyota Mirai from empty. That compares to gas pumps which run at of 10 gallons per minute in the USA, with a gallon being the energy equivalent of a kilogram of hydrogen. Fuel cell cars are more efficient than internal combustion cars, so it’s more like ten gallons equivalent for a car in five minutes.
This is, of course, completely inadequate for heavy trucks, which would require 50 to 100 kilograms or more of hydrogen when refueling, leading to refueling times longer than charging times for battery electric trucks, up to 90 minutes. And it’s inadequate for mid-sized delivery vehicles as well, because those light vehicle stations are optimized to deliver about five kilograms before having to go through a lengthy recompression cycle. That’s part of the report from a study on a mid-sized delivery van’s trial in the UK, where refueling took three times as long, about 15 minutes, just to get 10 kilograms of hydrogen.
So a bunch of additional equipment of higher grade and greater cost is added to heavy vehicle refueling stations to make them somewhat better. Still not great. NREL in a test environment has managed to approximate diesel pump rates with pressurized hydrogen, but that’s a bespoke test facility and there’s no guarantee that it would be remotely economic or commercializable.
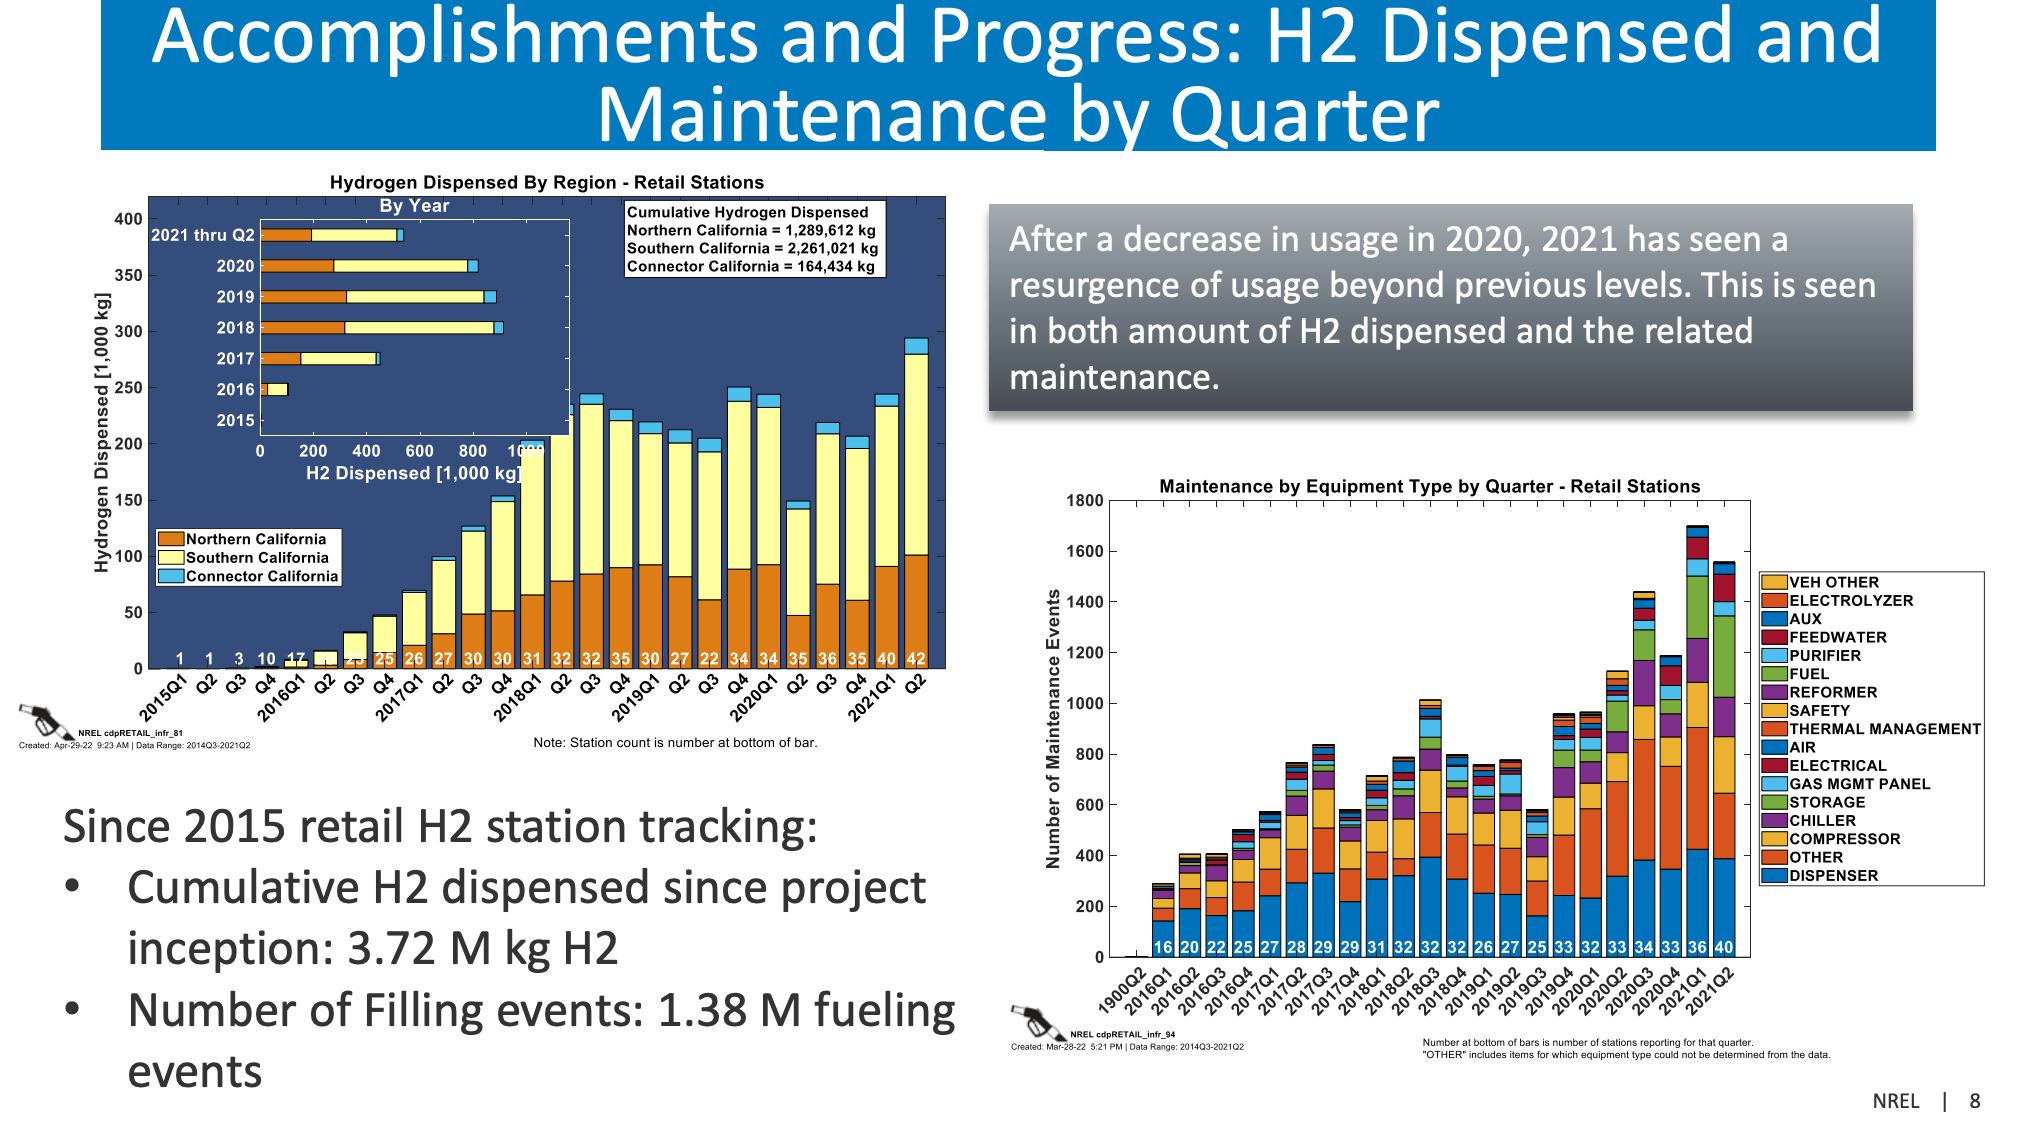
The charts on page eight of the report make it clear that there’s a strong, reasonably predictive, linear correlation between the amount of hydrogen pumped and maintenance requirements, something that’s the same as with gas station studies I looked at. Pump four times as much hydrogen, do four times as much maintenance.
But they don’t make it clear how much maintenance hydrogen refueling stations required. That needed math with numbers presented on different pages of the report.
The first number was the kilograms of hydrogen pumped. I chose the first half of 2021, six months of data after COVID, when pumped hydrogen tonnages were the greatest in the history of the program, and five years of improvements to hydrogen pumps and operational excellence programs had time to run their course.
Across the 55 stations, 540,000 kilograms of hydrogen were dispensed to the over 13,000 hydrogen vehicles in California. Yes, that US state has more hydrogen vehicles on its roads than any other country in the world, including China. But that’s still only 236 vehicles per station on average.
Some stations were dispensing as much as 300 kilograms a day, which is to say, a tiny fraction of the number of gallons of gasoline the average pump delivers daily. Of course, they took 10 times longer to deliver those kilograms, so the stations look busier than they are.
55 stations and 540,000 kilograms in the last two quarters of data is only 54 kilograms per station per day on average. Assuming 3 kilograms — 60% — refueling per vehicle, each station only sees 18 vehicles a day. That means that they are refueling every 13 days on average. That means that the average fuel cell vehicle is being driven about 15 miles a day, a long way under the 37 miles per day average for the USA.
Over the same period, there were 3,250 maintenance events recorded, between scheduled and unscheduled events, preventative maintenance and fixing things that went wrong. The report doesn’t have maintenance hours per event for that period, but has the historical mean of five years of 3.6 hours per event on another page.
Very little math indicates that the 55 stations appear to have seen 11,700 hours of maintenance in six months, about 212 per station or about 1.2 hours a day. As far as I can tell, none of this is daily inspection and bolt tightening, but scheduled and unscheduled maintenance events which take the pump out of service. 27% of maintenance events took an hour or less to address, with the median being a quite high 2.5 hours and a lot of events taking over a dozen hours or even 24 to fix.
Is that high? It seemed so. I went to look for equivalent data for gas stations. I found a 2013 study, Analysis and Scheduling of Maintenance Operations for a Chain of Gas Stations, with data for 570 pumps in 40 stations. It found that medium failure stations had 0.002 failures per hour per dispenser. With an average of 14 pumps per station, these weren’t low volume dusty stations but very busy. I wasn’t able to determine if ‘hours’ was hours actively used or total hours, but even an order of magnitude difference wouldn’t be a lot of failures per hour.
The study was focused on mean time between failures requiring maintenance and the benefits of preventative maintenance, so it didn’t have duration of maintenance activities, but made it clear that with average preventative maintenance, a station with 14 pumps saw a failure every 550 hours or so, or any given pump just sitting there and working for a third of the year without more than inspection, wiping and tightening of bolts.
So what does it look like for California’s hydrogen refueling stations? Remember, most of them have only one or two pumps on a gas station’s lot.
Well, given the 0.93 kilograms average flow rate, these stations appeared to require 3.6 hours of maintenance for every 46 kilograms of hydrogen that they pumped.
Total maintenance hours — once again derived from stated mean duration and the number of events but not stated explicitly in the NREL report — was 11,700 hours over the 55 stations over the first six months of 2021.
Total time pumping hydrogen at the 0.93 flow rate was 9,677 hours.
California’s hydrogen refueling stations spent 2,000 more hours being fixed and maintained than they spent pumping hydrogen in the first half of 2021.
If I had written this report, this first finding would have been front and center in big screaming letters. Instead, I had to dig hard to find it. But what about costs?
Given that we are dealing with 700 atmosphere pressures, equivalent to being over four miles under the surface of the ocean, we aren’t talking cheap technicians from Joe’s Gas Station Maintenance.
On page 14 of the report it announces, without context, that the cost per maintenance was over $10,000 per station per quarter, or over $40,000 per year. I dug into that further and found their underlying data set which showed maintenance costs were rising linearly with usage, and usage remained very low. The last four quarters of their data was showing about $50,000 per station per year.
For two quarters for the 55 stations then, the total expenditure was $1,375,000. That puts the hourly cost of maintenance at $118.
How low is the usage compared to gas stations? The average pump is designed to move over 300,000 gallons a year in normal usage, about 900 gallons a day. The average gas station in the report on gas stations had 14 pumps, so over 10,000 gallons per day. The 300 kilograms per day for the biggest hydrogen refueling station is a homeopathic amount, with the very high capital costs, ranging between $1,200 and $3,000 per kilogram of hydrogen dispensed per day per a 2020 DOE Hydrogen Program report, not being amortized across a lot of kilograms.
That report indicated that stations being acquired were capable of 770 kg/day to 1,620 kg/day when the busiest stations in all of California were just hitting 300 kg. To be clear, the existing refueling stations were capable of delivering more hydrogen, they just weren’t being called upon to do so because there are so few hydrogen vehicles and they were being driven so little.
Let’s make some cost assumptions. The study on hydrogen costs made it clear that costs had come down. Let’s assume that the existing 55 stations were at the very high end of the range, $3,000 per kilogram of hydrogen dispensed. Let’s assumed that they were sized for a lot more than they are delivering, and clearly over 300 kilograms a day. Let’s assume the bottom end of the range of 770 kg/day. That makes the capital costs of the average station at $2.3 million, with 55 of them costing about $130 million.
The maintenance expense of 4% of capex suggests that they would be spending about $5 million per year, but they are only spending $1,375,000 a year. Seems good.
But they are only pumping 54 kilograms per station per day and as the data shows, maintenance rises linearly with kilograms delivered. Scaling the 54 kilograms averaging to 770 kilograms suggests that the actual maintenance cost if the stations were running at planned capacity would be $20 million per year.
That’s 15% of capex, not 4% of capex. And it’s not 10% of capex which is apparently what hydrogen refueling station sales people are promising. Clearly what they are doing in bids is preparing buyers for the even worse reality of hydrogen refueling.
Let’s take a brief digression into Reference Class Forecasting. It’s the estimation method that Professor Bent Flyvbjerg and his team devised over the almost 30 years they’ve spent gathering data on megaprojects.
Here’s RCF in a nutshell. Get all the data you can about the thing you are trying to do. Find the average. Use that in your estimations. If you are building a bridge, get all of the actual costs of bridges that have been built you can find. Average it out. Start with that. Adjust upward or downward only if you have a really strong reason to believe you are special.
If you’ve read Flyvbjerg and co-author Dan Gardner’s book, How Big Things Get Done, which is on every best business books of 2023 list, often at the top, you have read about RCF and how to apply it. And if you haven’t read Big Things, do so now.
What does this mean for trucking total cost of ownership studies? If they are costing the stations, and they should, they should cost the maintenance at 15% of capex, not 4% of capex.
If I were reporting the DOE annual meeting and had been presenting the report I found, this would have been just under the 2,000 hours more maintenance than pumping finding, in even bigger letters.
Okay, how many excuses can we make for this data to explain it away? This is in aid of pre-loading the arguments.
#1: The technology isn’t mature and things will get better!
Hydrogen refueling stations have been being deployed globally for over 25 years, California has more of them than any other country, and this is the last couple of quarters of six years of data, so there’s been time to ditch the lemons and optimize maintenance.
#2: Scaling up the actual maintenance costs isn’t fair!
The curve fitting on kilograms pumped vs maintenance events is linear from their own data and supported by gas station pumping maintenance studies. I gave them the benefit of the doubt on costs and capacity to get down to 15%. Initial numbers were worse, so I’ve been triple checking and redoing them. Suggest a better methodology and apply it to the data.
#3: This data is for light vehicle stations and heavier vehicle stations will be more reliable!
No, the added complexity and requirements for high-speed hydrogen transfer make it harder to achieve reliability, not less. The likelihood is that this 15% finding is too low for trucks. As a reminder the 10% anecdotal data was for 350 atmosphere pressure pumping systems..
#4: It doesn’t matter because we’ll be using liquid hydrogen instead!
No, storing and pumping hydrogen at 20° above absolute zero is much more complex than 700 atmosphere pressure gas. The challenges with thermal and pressure management are multiplied, as are the dangers. Liquid hydrogen is so hard to use that the space industry is moving to methane and away from liquid hydrogen.
#5: They are just falling apart because no one is using them, and will be better with more use!
That doesn’t really make a point a hydrogen advocate really wants to make, and see point #2.
#6: The data is bad, just cooked up by the author!
The data is all from NREL hydrogen program reports about actual findings in actual gas stations.
#7: I spotted an immaterial error, so am giving myself permission to invalidate the entire assessment!
Don’t be that person.
#8: I don’t like the results!
In that case, you really need to sit with this other article of mine — Seeing Climate Solutions Clearly Through Biases & Missing Data Is Challenging — for a while and reflect on your life choices.
So, to sum up, hydrogen refueling stations in the biggest public data set, covering 55 stations over six years with millions of kilograms of hydrogen having been delivered, show that hydrogen stations are out of service 20% more time than they are pumping hydrogen and that annual maintenance costs are 15% of capex, not 4%.
Do I expect the ICCT, Daimler, hydrogen refueling vendors and the US DOE to now start using 15%? No, I expect them to recreate the study I’ve just done using California’s data and more real data on capital expenditures, and come up with a number that is much more realistic than 4%. Personally, I’m comfortable with 15% and will be using it and recommending to groups I engage with that they use it.
Have a tip for CleanTechnica? Want to advertise? Want to suggest a guest for our CleanTech Talk podcast? Contact us here.
Latest CleanTechnica TV Video
[embedded content]I don't like paywalls. You don't like paywalls. Who likes paywalls? Here at CleanTechnica, we implemented a limited paywall for a while, but it always felt wrong — and it was always tough to decide what we should put behind there. In theory, your most exclusive and best content goes behind a paywall. But then fewer people read it!! So, we've decided to completely nix paywalls here at CleanTechnica. But...
Thank you!
Advertisement
CleanTechnica uses affiliate links. See our policy here.
- SEO Powered Content & PR Distribution. Get Amplified Today.
- PlatoData.Network Vertical Generative Ai. Empower Yourself. Access Here.
- PlatoAiStream. Web3 Intelligence. Knowledge Amplified. Access Here.
- PlatoESG. Carbon, CleanTech, Energy, Environment, Solar, Waste Management. Access Here.
- PlatoHealth. Biotech and Clinical Trials Intelligence. Access Here.
- Source: https://cleantechnica.com/2024/01/27/californias-hydrogen-stations-being-fixed-more-hours-than-pumping-at-15-capex-per-year/
- :has
- :is
- :not
- :where
- $3
- $UP
- 000
- 07
- 1
- 10
- 100
- 110
- 13
- 14
- 15%
- 200
- 2010
- 2013
- 2018
- 2019
- 2021
- 2022
- 2023
- 212
- 24
- 25
- 250
- 30
- 300
- 350
- 36
- 40
- 46
- 50
- 54
- 700
- 90
- a
- Able
- About
- above
- Absolute
- Achieve
- acquired
- across
- actively
- activities
- actual
- actually
- added
- Additional
- address
- Adds
- adjust
- Advertise
- advocate
- Affiliate
- After
- again
- Aid
- AIR
- AL
- All
- almost
- also
- always
- am
- america
- amount
- an
- and
- Announces
- annual
- Another
- any
- apart
- appear
- appeared
- appears
- Apply
- approximate
- ARE
- arguments
- article
- AS
- assume
- assumed
- assumptions
- At
- Atmosphere
- atmospheric
- available
- average
- averaging
- aware
- away
- back
- Bad
- Baseline
- battery
- BE
- because
- been
- before
- behind
- being
- believe
- benefit
- benefits
- bespoke
- BEST
- Better
- between
- biases
- Big
- bigger
- Biggest
- Bit
- Bolt
- book
- Books
- Bottom
- BRIDGE
- bridges
- briefly
- build
- Building
- built
- Bunch
- Buses
- business
- busy
- but
- buyers
- by
- california
- called
- came
- CAN
- capable
- Capacity
- capital
- capital expenditure
- car
- cars
- case
- cell
- Center
- chain
- challenges
- characteristics
- charging
- Charts
- cheap
- checking
- chemical
- China
- chip
- choices
- chose
- class
- clean
- cleantech
- Cleantech Talk
- clear
- clearly
- Climate
- Co-Author
- combined
- come
- comfortable
- Companies
- compared
- completely
- complex
- complexity
- considering
- content
- context
- cooked
- Correlation
- Cost
- Costs
- Council
- count
- countries
- country
- Couple
- course
- covered
- covering
- Covid
- Current
- curve
- cycle
- daily
- Daimler
- dangers
- data
- data set
- day
- Days
- dealing
- decide
- decided
- deliver
- delivered
- delivering
- delivers
- delivery
- Demand
- deployed
- Derived
- designed
- Determine
- diesel
- difference
- different
- DIG
- ditch
- do
- DOE
- does
- Doesn’t
- doing
- don
- done
- Dont
- doubt
- down
- downward
- dozen
- driven
- duration
- E&T
- each
- Economic
- efficient
- eight
- Electric
- embedded
- empty
- end
- ended
- energy
- engage
- engineer
- enough
- Entire
- Environment
- equipment
- Equivalent
- error
- Ether (ETH)
- Europe
- European
- evaluation
- Even
- Event
- events
- Every
- evidence
- Excellence
- Exclusive
- existing
- expect
- Explain
- explicitly
- extreme
- Facility
- Failure
- failures
- Falling
- far
- felt
- few
- fewer
- fill
- Find
- finding
- findings
- First
- fitting
- five
- Fix
- fixed
- FLEET
- flow
- focused
- For
- found
- four
- fraction
- from
- front
- Fuel
- further
- GAS
- gasoline
- gathering
- gave
- generation
- get
- given
- Giving
- Globally
- Go
- Goes
- good
- grade
- great
- greater
- greatest
- Group
- Group’s
- guarantee
- Guest
- had
- Half
- Hard
- harder
- Have
- having
- he
- heavy
- help
- here
- High
- higher
- his
- historical
- history
- hitting
- hold
- hope
- hour
- HOURS
- How
- How To
- HTTPS
- hydrogen
- Hydrogen Fuel
- Hyundai
- i
- if
- implemented
- improvements
- in
- included
- Including
- Increase
- indicated
- indicates
- indicating
- industry
- initial
- instead
- intended
- internal
- International
- into
- IT
- ITS
- just
- labor
- Last
- later
- leading
- left
- less
- Life
- light
- like
- likelihood
- likes
- Limited
- links
- Liquid
- List
- little
- Long
- longer
- Look
- look like
- looked
- Lot
- Low
- made
- maintenance
- make
- MAKES
- managed
- management
- many
- math
- Matter
- mature
- max-width
- me
- mean
- meaning
- means
- Media
- medium
- meeting
- Merit
- methane
- method
- Methodology
- million
- millions
- mine
- minute
- minutes
- missing
- months
- more
- more efficient
- most
- mostly
- move
- moving
- much
- multiple
- multiplied
- myself
- Need
- needed
- never
- New
- news
- no
- None
- normal
- North
- north america
- now
- number
- numbers
- Nutshell
- ocean
- of
- often
- on
- once
- ONE
- only
- operation
- operational
- Operations
- Optimize
- optimized
- or
- order
- organizations
- Other
- Others
- our
- out
- over
- own
- ownership
- page
- pages
- part
- peer
- People
- per
- period
- permission
- person
- Personally
- Places
- planned
- plato
- Plato Data Intelligence
- PlatoData
- player
- podcast
- Point
- policy
- Post
- pre-COVID
- predictive
- preparing
- presented
- pressure
- previous
- principles
- Professor
- Program
- Programs
- promising
- public
- Publication
- publish
- pump
- pumping
- pumps
- put
- Puts
- Q2
- Quarter
- quite
- quotes
- range
- ranges
- ranging
- Rate
- Rates
- Read
- Reader
- real
- realistic
- Reality
- really
- reason
- received
- recently
- recommending
- recorded
- reference
- reflect
- Refueling
- related
- reliability
- remained
- remains
- remember
- reminder
- remotely
- report
- Reporting
- Reports
- require
- required
- Requirements
- research
- retail
- review
- reviewing
- Rises
- rising
- road
- roads
- Run
- running
- s
- sales
- same
- saw
- say
- Scale
- scaling
- scheduled
- scheduling
- screaming
- see
- seemed
- seems
- seen
- sees
- serious
- service
- set
- Share
- should
- show
- showed
- showing
- Shows
- similar
- simulation
- single
- sit
- Sitting
- SIX
- Six months
- sized
- slow
- So
- solution
- Solutions
- some
- something
- somewhat
- Source
- Space
- space industry
- special
- Spending
- spent
- split
- start
- State
- stated
- station
- Stations
- Still
- Stories
- strong
- studies
- Study
- sufficient
- suggest
- Suggests
- sum
- support
- Supported
- Surface
- system
- systemic
- Systems
- T
- Take
- takes
- taking
- Talk
- talking
- team
- Technology
- tell
- ten
- test
- than
- that
- The
- The Capital
- The State
- the UK
- the world
- their
- Them
- then
- theory
- There.
- thermal
- These
- they
- thing
- things
- Third
- this
- those
- three
- Through
- tightening
- time
- times
- tip
- to
- today
- told
- too
- took
- top
- Total
- tough
- toyota
- track
- transfer
- transit
- transportation
- traveled
- Triple
- truck
- Trucking
- Trucks
- true
- trying
- tv
- two
- Uk
- under
- underlying
- undoubtedly
- unfortunate
- unfortunately
- Updates
- upon
- upward
- us
- USA
- Usage
- use
- used
- uses
- using
- usually
- Ve
- vehicle
- Vehicles
- vendors
- very
- Video
- volume
- vs
- want
- wants
- was
- Way..
- we
- WELL
- went
- were
- What
- when
- whether
- which
- while
- WHO
- will
- wiping
- with
- without
- working
- world
- worse
- would
- write
- writing
- written
- Wrong
- year
- years
- yes
- yet
- you
- Your
- youtube
- zephyrnet
- zero