- DYDX market shows solid bullish momentum with potential for a short-term pullback.
- MACD and Aroon-up indicators suggest an excellent time for buyers to enter.
- Traders should monitor CMF for a potential shift in purchasing pressure.
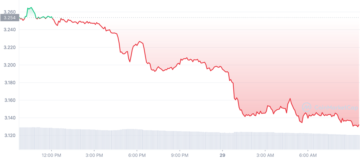
The dYdX (DYDX) market has been bullish in the previous 24 hours due to a continuous bull reign looming on its market. The strong momentum in the DYDX market lifted the price from an intra-day low of $2.30 to a 24-hour high of $2.51. At this writing, the bulls’ dominance was still felt in the market, driving DYDX to rise by 6.46% to $2.48.
This price increase is likely due to increased DYDX demand as more investors expect more market gains. The market capitalization climbed by 6.34% to $387,103,072 to support this positive sentiment.
Nevertheless, since the 24-hour trading volume fell by 38.78% to $168,150,255, the gain in market capitalization may need to be revised. This revision may be attributable to a few huge deals rather than broad purchasing activity, which might lead to instability in the near term.
Moving Average Convergence Divergence (MACD) climbs above its signal line and moves in the positive zone, suggesting a bullish market for DYDX. Its bullish view is demonstrated by a reading of 0.00640688, while its signal line reads -0.00019705.
With this MACD movement, traders may consider going long on the market as buying pressure rises. The histogram’s greening bars pointing to an ongoing uptrend add to the bullishness, suggesting that momentum is shifting in favor of buyers.
Nevertheless, with a reading of 75.22 on the stochastic RSI, the DYDX is overbought and may be ready for a short-term pullback or consolidation before continuing its uptrend.
In addition, it has formed a bearish crossing by falling below its signal line, suggesting that investors should wait for more proof of a reversal before buying. In contrast, existing investors may consider cashing out some of their gains or setting a stop-loss order to limit their losses.
The Aroon up on the DYDX 2-hour price chart is 85.71%, while the Aroon down is 7.14%, indicating that the bullish trend is strong and likely to continue soon. This 78.57% difference between the Aroon up and down is a bullish indicator for buyers, suggesting that the price is experiencing more significant highs and lower lows and may be an excellent time to join the market.
The Chaikin Money Flow indicator rises north with a value of 0.07, indicating a minor increase in purchasing pressure and money flow into the market, supporting the prospect of a positive trend soon.
Nevertheless, if the CMF swings south towards the “0” line, it might imply a decline in purchasing pressure and the possibility of a negative trend, which would need close market monitoring.
DYDX market shows bullish momentum with a potential short-term pullback, but Aroon and CMF indicators suggest substantial buying opportunities.
Disclaimer: The views, opinions, and information shared in this price prediction are published in good faith. Readers must do their research and due diligence. Any action taken by the reader is strictly at their own risk. Coin Edition and its affiliates will not be liable for direct or indirect damage or loss.
Post Views: 34
- SEO Powered Content & PR Distribution. Get Amplified Today.
- Platoblockchain. Web3 Metaverse Intelligence. Knowledge Amplified. Access Here.
- Source: https://coinedition.com/bullish-dydx-rallies-overbought-conditions-may-trigger-a-pullback/
- :is
- $UP
- 7
- a
- above
- Action
- activity
- addition
- affiliates
- and
- ARE
- AS
- At
- average
- bars
- BE
- bearish
- before
- below
- between
- broad
- bull
- Bullish
- bullish indicator
- buyers
- Buying
- by
- capitalization
- Chart
- Climbed
- Close
- Coin
- Coin Edition
- conditions
- Consider
- consolidation
- continue
- continuing
- continuous
- contrast
- Convergence
- Deals
- Decline
- Demand
- demonstrated
- difference
- diligence
- direct
- Divergence
- Dominance
- down
- driving
- dydx
- edition
- Enter
- excellent
- existing
- expect
- experiencing
- faith
- Falling
- favor
- few
- flow
- For
- formed
- from
- Gain
- Gains
- going
- good
- High
- Highs
- HOURS
- HTTPS
- huge
- in
- Increase
- increased
- indicating
- Indicator
- Indicators
- information
- instability
- Investors
- IT
- ITS
- join
- jpg
- lead
- Lifted
- likely
- LIMIT
- Line
- Long
- looming
- losses
- Low
- Lows
- MACD
- Market
- Market Capitalization
- might
- minor
- Momentum
- money
- Monitor
- monitoring
- more
- movement
- moves
- Near
- Need
- negative
- North
- of
- on
- ongoing
- Opinions
- opportunities
- order
- own
- plato
- Plato Data Intelligence
- PlatoData
- positive
- possibility
- potential
- prediction
- pressure
- previous
- price
- price chart
- Price Increase
- Price Prediction
- proof
- prospect
- published
- pullback
- purchasing
- rallies
- rather
- Reader
- readers
- Reading
- ready
- research
- Reversal
- Rise
- Rises
- Risk
- rsi
- sentiment
- setting
- shared
- shift
- SHIFTING
- short-term
- should
- Shows
- Signal
- significant
- since
- solid
- some
- Soon
- South
- Still
- strong
- substantial
- support
- Supporting
- Swings
- that
- The
- their
- time
- to
- towards
- Traders
- Trading
- trading volume
- Trend
- trigger
- uptrend
- value
- View
- views
- volume
- wait
- which
- while
- will
- with
- would
- writing
- zephyrnet