The Bitcoin price analysis is indicating a decline in the price today. The bears have won the leading position as the selling pressure has formed again and the price is decreasing again. For the past few days, bearish pressure has been dominating the market and this current price action is likely to continue with a downward trajectory. As for the overall trend, Bitcoin continues to move in a downtrend and is yet to find a clear support level.
The previous week BTC rallied to $30,000, with the buying pressure increasing but failed to sustain the bullish momentum and has since been in a downtrend. The price is currently testing support around the $27,855 level. If this support level breaks then we could see a further dip in prices as low as $26,500 or potentially lower.
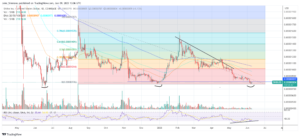
Bitcoin price analysis 1-day price chart: BTC experiences its first drop after a successive streak
The one-day Bitcoin price analysis is showing a bearish momentum today, and the price has decreased to $27,855, with a decrease of 2.3 per cent. The selling pressure is still in control and the price is likely to continue with its downtrend. The resistance level remains at $28,800 which was tested before the current downtrend.
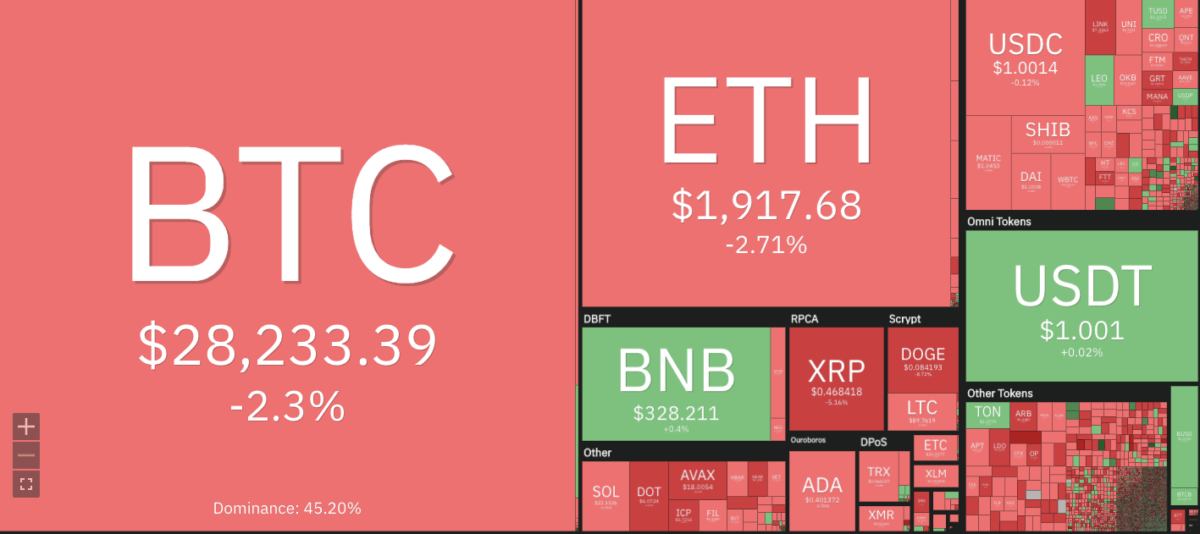
The 24-hour trading volume for the token is also declining and currently stands at $20 billion, with a decrease of 0.22 per cent in the last 24 hours. The market capitalization is at $544 billion, indicating a decrease of 2.33 per cent in the last 24 hours. The circulating supply is at 19,352,368 BTC.

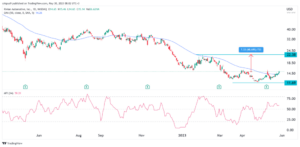
The Bollinger bands on the daily chart are also converging indicating high price volatility in the market. The upper Bollinger band is at $31,180 and the lower Bollinger band is at $27,105, indicating that the price is likely to remain within this range in the near term. The moving average convergence/divergence (MACD) is still in the bearish region and the MACD line has crossed below the signal line. The Relative Strength Index (RSI) is also in the bearish region and at present, it stands at 47.34.
Bitcoin price analysis: Recent developments and further technical indications
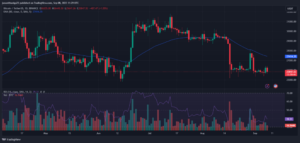
The 4-hour Bitcoin price analysis shows that cryptocurrency is still experiencing negative market sentiment. The price levels have been steadily declining, and there is a strong likelihood that they will do so in the future. The price dip earlier prevented the bulls from succeeding in their attempts to go past the barrier at $28,906.

The 4-hour Bollinger bands are also going, indicating high short-price volatility. The upper Bollinger band is at $30,870, and the lower Bollinger band is at $27,542. The MACD line has crossed below the signal line and is in the bearish region. The red line of the Awesome Oscillator is also below the blue line, indicating bearish market sentiment. The Relative Strength Index (RSI) stands at 31.04, indicating that the market is oversold and may be ready for a rebound soon.
Bitcoin price analysis conclusion
The overall sentiment for Bitcoin remains bearish and the downward trajectory may continue until it finds support. The current technical indicators are also indicating a bearish trend, with the red candlestick forming in the bot chart. The current support level of $27,855 may be tested further and a breach of this level may take the price even lower.
While waiting for Bitcoin to move further, see our Price Predictions on XDC, Polkadot, and Curve
Source: https://www.cryptopolitan.com/bitcoin-price-analysis-2023-04-21/
- SEO Powered Content & PR Distribution. Get Amplified Today.
- Platoblockchain. Web3 Metaverse Intelligence. Knowledge Amplified. Access Here.
- Minting the Future w Adryenn Ashley. Access Here.
- Source: https://bitcoinethereumnews.com/bitcoin/btc-touches-28233-as-bearish-drive-continues-cryptopolitan/?utm_source=rss&utm_medium=rss&utm_campaign=btc-touches-28233-as-bearish-drive-continues-cryptopolitan
- :has
- :is
- 000
- 500
- a
- Action
- After
- also
- analysis
- and
- ARE
- around
- AS
- At
- Attempts
- auto
- average
- BAND
- barrier
- BE
- bearish
- bearish market
- Bearish Momentum
- Bears
- been
- before
- below
- Billion
- Bitcoin
- Bitcoin Price
- Bitcoin Price Analysis
- blockchain
- Blue
- Bollinger bands
- Bot
- breach
- breaks
- BTC
- Bullish
- Bulls
- but
- Buying
- capitalization
- Chart
- circulating
- clear
- continue
- continues
- control
- converging
- could
- Crossed
- cryptocurrency
- Cryptopolitan
- Current
- Currently
- daily
- Days
- Decline
- Declining
- decrease
- developments
- Dip
- downward
- drive
- Drop
- Earlier
- Even
- Experiences
- experiencing
- Failed
- few
- Find
- finds
- First
- fluid
- For
- formed
- from
- further
- future
- Go
- going
- Have
- High
- HOURS
- HTTPS
- image
- in
- increasing
- index
- indicating
- Indicators
- IT
- ITS
- Last
- leading
- Level
- levels
- likely
- Line
- Low
- MACD
- map
- Market
- Market Capitalization
- market sentiment
- max-width
- May..
- Momentum
- move
- moving
- moving average
- Near
- negative
- of
- on
- or
- our
- overall
- past
- plato
- Plato Data Intelligence
- PlatoData
- Polkadot
- position
- potentially
- Predictions
- present
- pressure
- previous
- price
- PRICE ACTION
- Price Analysis
- price chart
- Prices
- range
- ready
- rebound
- recent
- Red
- region
- relative strength index
- Relative Strength Index (RSI)
- remain
- remains
- Resistance
- rsi
- Selling
- sentiment
- Shows
- Signal
- since
- So
- Soon
- Source
- stands
- Still
- strength
- strong
- supply
- support
- support level
- Take
- Technical
- Testing
- that
- The
- The Future
- their
- There.
- they
- this
- to
- today
- token
- Trading
- trading volume
- trajectory
- Trend
- true
- Volatility
- volume
- Waiting
- was
- we
- week
- which
- will
- with
- within
- Won
- XDC
- zephyrnet


![Bitcoin [BTC]: To sink or swim, investors unsure of market’s next direction](https://platoaistream.com/wp-content/uploads/2023/05/bitcoin-btc-to-sink-or-swim-investors-unsure-of-markets-next-direction-300x119.webp)