BNB price (Binance coin) is struggling to clear the $310 resistance against the US Dollar. It could continue to move down if there is a drop below $295.
- Binance coin price is struggling to gain momentum above the $310 resistance against the US Dollar.
- The price is now trading below $310 and the 100 simple moving average (4-hours).
- There is a key bearish trend line forming with resistance near $308 on the 4-hours chart of the BNB/USD pair (data source from Binance).
- The pair could resume its decline if there is no clear move above $310.
Binance Coin Price Faces Hurdles
This past week, BNB price saw a strong bearish reaction from the $325 resistance zone. The price declined below the $320 and $310 levels. It even spiked below the $300 level and tested $295.
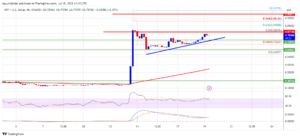
A low is formed near $295 and the price is now recovering losses, similar to bitcoin and ethereum. It is trading below $310 and the 100 simple moving average (4-hours). There is also a key bearish trend line forming with resistance near $308 on the 4-hours chart of the BNB/USD pair.
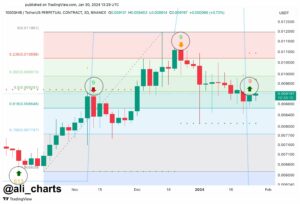
On the upside, an immediate resistance is near the $308 zone and the trend line. It is near the 50% Fib retracement level of the downward move from the $320 swing high to $295 low.
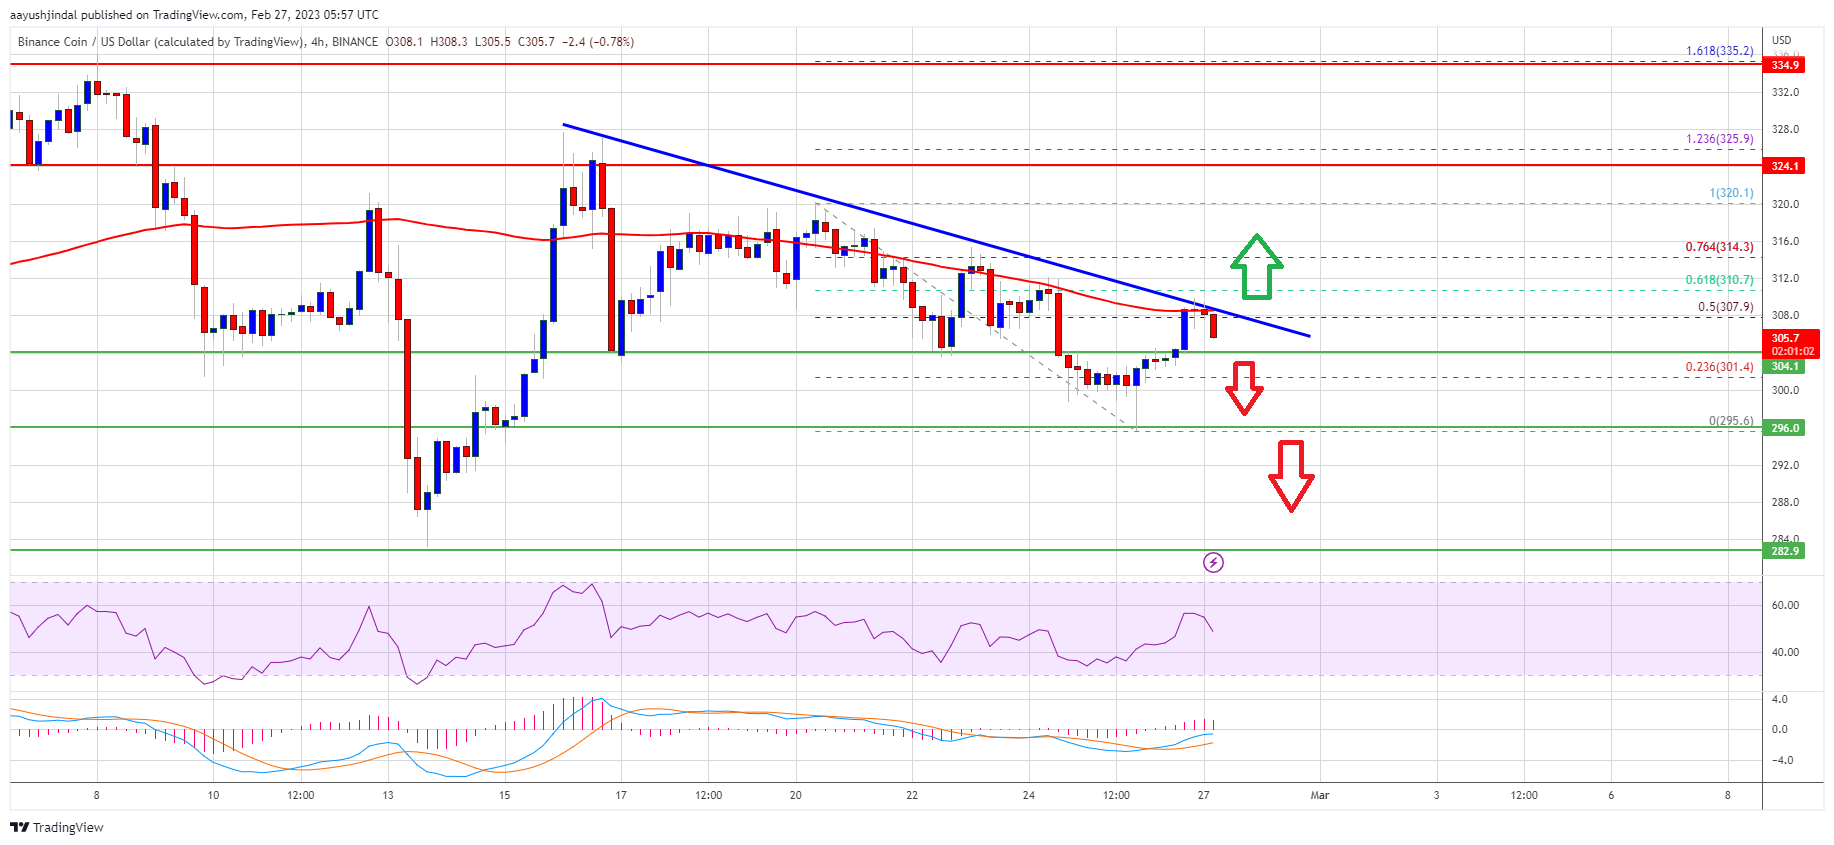
Source: BNBUSD on TradingView.com
The next major resistance is near the $310 level. It is near the 61.8% Fib retracement level of the downward move from the $320 swing high to $295 low. A clear move above the trend line and then $310 might send the price towards the $320 resistance. Any more gains might send the price towards the $325 level.
More Losses in BNB?
If BNB fails to clear the $310 resistance, it could continue to move down. An initial support on the downside is near the $300 level.
The first major support is near the $295 level. The next major support is near the $282 level. If there is a downside break below the $282 support, there could be an extended decline towards the $265 support.
Technical Indicators
4-Hours MACD – The MACD for BNB/USD is losing pace in the bullish zone.
4-Hours RSI (Relative Strength Index) – The RSI for BNB/USD is currently below the 50 level.
Major Support Levels – $300, $295 and $282.
Major Resistance Levels – $308, $310 and $325.
- SEO Powered Content & PR Distribution. Get Amplified Today.
- Platoblockchain. Web3 Metaverse Intelligence. Knowledge Amplified. Access Here.
- Source: https://www.newsbtc.com/analysis/bnb/bnb-price-prints-bearish-technical-pattern-why-it-could-revisit-280/
- 100
- a
- above
- against
- and
- average
- bearish
- below
- binance
- Binance Coin
- bnb
- BNB Price
- BNB/USD
- Break
- Bullish
- Chart
- clear
- Coin
- continue
- could
- Currently
- data
- Decline
- Dollar
- down
- downside
- downward
- Drop
- Even
- faces
- fails
- First
- formed
- from
- Gain
- Gains
- High
- HTTPS
- immediate
- in
- index
- initial
- IT
- Key
- Level
- levels
- Line
- losing
- losses
- Low
- MACD
- major
- max-width
- might
- Momentum
- more
- move
- moving
- moving average
- Near
- NewsBTC
- next
- Pace
- past
- Pattern
- plato
- Plato Data Intelligence
- PlatoData
- price
- prints
- reaction
- recovering
- relative strength index
- Resistance
- resume
- retracement
- rsi
- similar
- Simple
- Source
- strength
- strong
- Struggling
- support
- support levels
- Technical
- The
- to
- towards
- Trading
- TradingView
- Trend
- Upside
- us
- US Dollar
- week
- zephyrnet