BNB price (Binance coin) faced a major resistance near $345 against the US Dollar. It is now testing key support at $325, below which it might dive to $315.
- Binance coin price is slowly moving lower from the $345 resistance against the US Dollar.
- The price is now trading below $330 and the 100 simple moving average (4 hours).
- There is a key bullish trend line forming with support near $325 on the 4-hour chart of the BNB/USD pair (data source from Binance).
- The pair could start a fresh increase if it stays above $325.
Binance Coin Price Holds Support
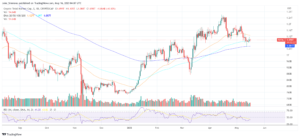
This past week, BNB price saw a decent increase above the $325 level, similar to Bitcoin and Ethereum. The bulls were able to push the price above the $335 and $340 levels.
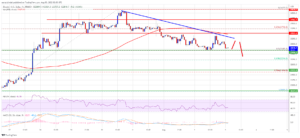
However, the price faced strong resistance near the $345 level. A high was formed near $345 and the price started a steady decline. There was a move below the $340 and $335 support levels. The bears pushed the price below the 50% Fib retracement level of the upward move from the $315 swing low to the $345 high.
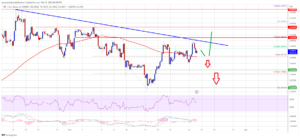
It is now trading below $330 and the 100 simple moving average (4 hours). Besides, there is a key bullish trend line forming with support near $325 on the 4-hour chart of the BNB/USD pair.
Source: BNBUSD on TradingView.com
On the upside, BNB is facing resistance near the $330 level and the 100 simple moving average (4 hours). The next major resistance is near the $335 level. A clear move above the $335 resistance might spark bullish moves. The next major resistance is near the $345 level, above which the price might rise toward the $350 resistance. Any more gains might send the price toward the $365 level.
More Losses in BNB?
If BNB fails to clear the $330 resistance, it could continue to move down. Initial support on the downside is near the $325 level or the trend line.
The next major support is near the $322 level. If there is a downside break below the $322 support, there could be an extended decline toward the $315 support.
Technical Indicators
4-Hours MACD – The MACD for BNB/USD is gaining pace in the bearish zone.
4-Hours RSI (Relative Strength Index) – The RSI for BNB/USD is currently below the 50 level.
Major Support Levels – $325, $322, and $315.
Major Resistance Levels – $330, $335, and $345.
- SEO Powered Content & PR Distribution. Get Amplified Today.
- PlatoAiStream. Web3 Data Intelligence. Knowledge Amplified. Access Here.
- Minting the Future w Adryenn Ashley. Access Here.
- Source: https://www.newsbtc.com/analysis/bnb/bnb-price-lacks-momentum-335/
- :is
- 100
- 50
- a
- Able
- above
- against
- an
- and
- any
- At
- average
- BE
- bearish
- Bears
- below
- besides
- binance
- Binance Coin
- bnb
- BNB Price
- BNB/USD
- Break
- Bullish
- Bulls
- but
- Chart
- clear
- Coin
- continue
- could
- Currently
- data
- Decline
- Dollar
- down
- downside
- faced
- facing
- fails
- For
- formed
- fresh
- fresh increase
- from
- gaining
- Gains
- High
- holds
- HOURS
- HTTPS
- if
- in
- Increase
- index
- initial
- IT
- Key
- Level
- levels
- likely
- Limited
- Line
- losses
- Low
- MACD
- major
- max-width
- might
- Momentum
- more
- move
- moves
- moving
- moving average
- Near
- NewsBTC
- next
- now
- of
- on
- or
- Pace
- past
- plato
- Plato Data Intelligence
- PlatoData
- price
- Push
- pushed
- relative strength index
- Resistance
- retracement
- Rise
- rsi
- send
- similar
- Simple
- Slowly
- Source
- Spark
- start
- started
- steady
- strength
- strong
- support
- support levels
- Swing
- Testing
- The
- There.
- to
- toward
- Trading
- TradingView
- Trend
- Upside
- upward
- us
- US Dollar
- was
- week
- were
- which
- with
- zephyrnet