BNB price (Binance coin) found support near $300 against the US Dollar. BNB rallied above $320 and might aim more upsides towards the $400 level.
- Binance coin price started a steady increase from the $300 support against the US Dollar.
- The price is now trading above $320 and the 100 simple moving average (4-hours).
- There was a break above a major contracting triangle with resistance near $320 on the 4-hours chart of the BNB/USD pair (data source from Binance).
- The pair could is rising and might climb further above the $335 resistance zone.
Binance Coin Price Rallies Over 5%
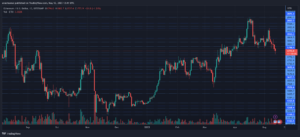
This past week, BNB price formed a support base above the $300 level. The bulls were active and they were able to pump the price above the $310 and $312 resistance levels.
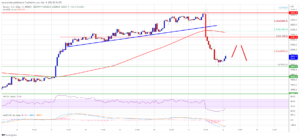
The price is up over 5% in a day and there was a move above the $320 resistance. Besides, there was a break above a major contracting triangle with resistance near $320 on the 4-hours chart of the BNB/USD pair. The pair is now showing positive signs, similar to bitcoin and ethereum.
BNB traded as high as $332 and is currently consolidating gains. It is now trading above $320 and the 100 simple moving average (4-hours). It is also well above the 23.6% Fib retracement level of the upward move from the $301 swing low to $332 high.
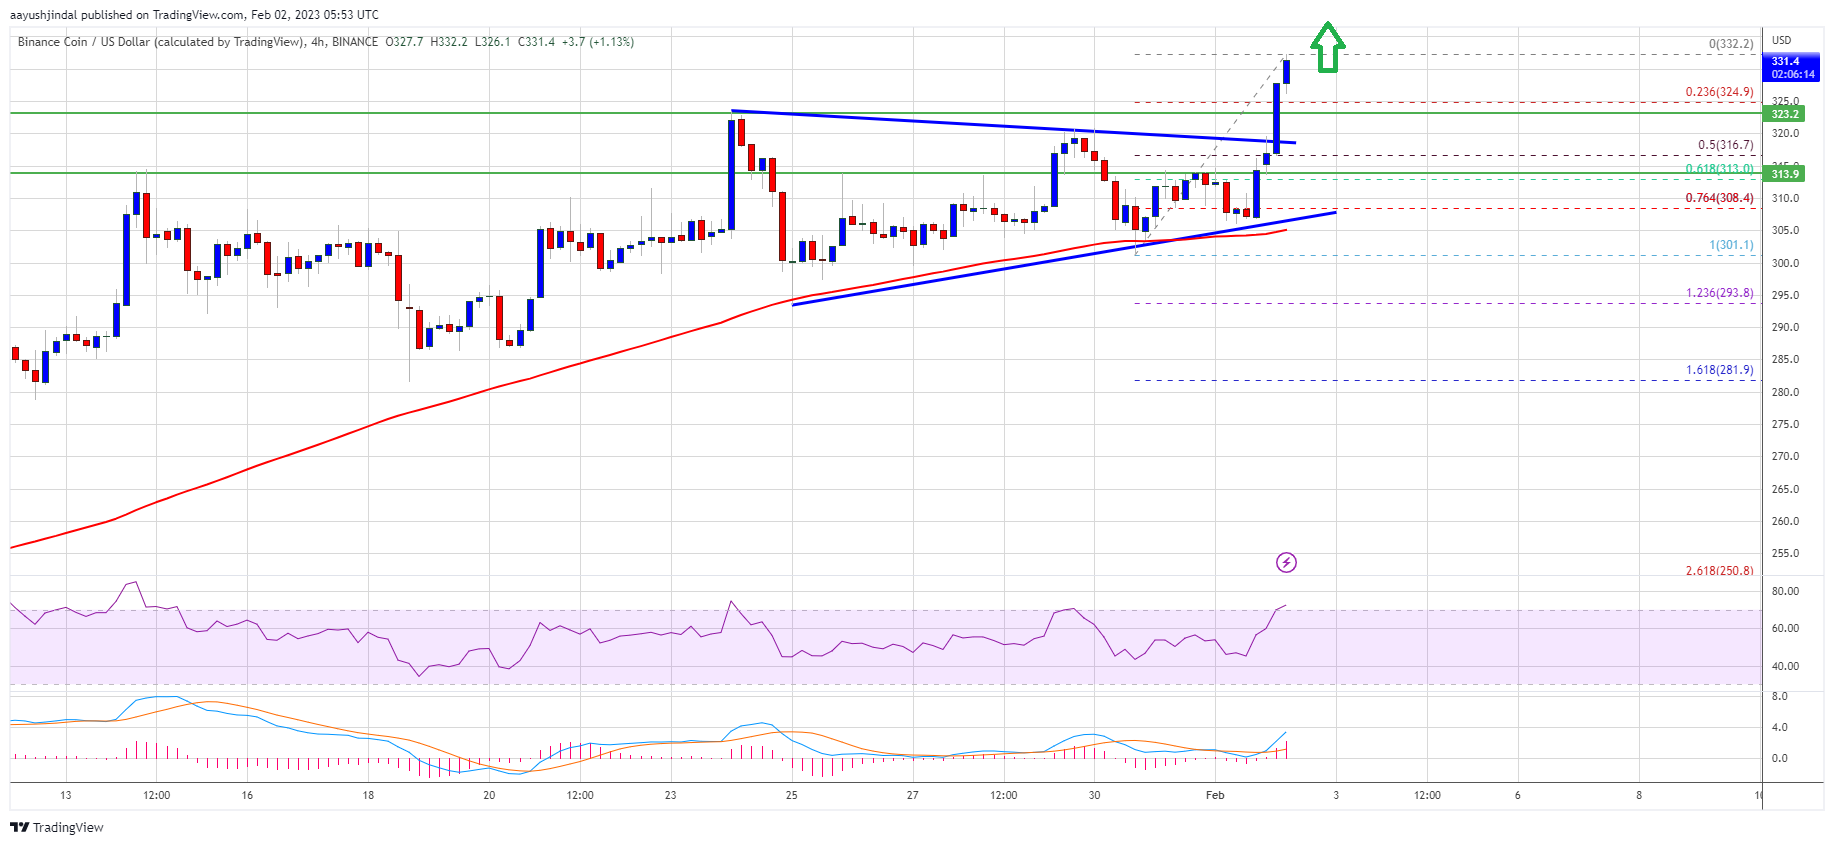
Source: BNBUSD on TradingView.com
On the upside, the bears are protecting the $332 and $332 resistance levels. The next major resistance is near the $350 level, above which the price is likely to aim a test of the $400 level in the near term. Any more gains might send the price towards the $420 level.
Dips Supported in BNB?
If BNB fails to clear the $335 resistance, it could start a downside correction. An initial support on the downside is near the $325 level.
The first major support is near the $315 level. It is near the 50% Fib retracement level of the upward move from the $301 swing low to $332 high. The next major support is near the $308 level. If there is a downside break below the $308 support, there could be an extended decline towards the $300 support.
Technical Indicators
4-Hours MACD – The MACD for BNB/USD is gaining pace in the bullish zone.
4-Hours RSI (Relative Strength Index) – The RSI for BNB/USD is currently above the 50 level.
Major Support Levels – $325, $315 and $308.
Major Resistance Levels – $335, $350 and $400.
- SEO Powered Content & PR Distribution. Get Amplified Today.
- Platoblockchain. Web3 Metaverse Intelligence. Knowledge Amplified. Access Here.
- Source: https://www.newsbtc.com/analysis/bnb/bnb-price-is-surging-400/
- 100
- a
- Able
- above
- active
- against
- and
- average
- base
- Bears
- below
- binance
- Binance Coin
- Binance Coin Price
- bnb
- BNB Price
- BNB/USD
- Break
- Bullish
- Bulls
- Chart
- clear
- climb
- Coin
- consolidating
- contracting
- could
- Currently
- data
- day
- Decline
- Dollar
- downside
- fails
- First
- formed
- found
- from
- further
- gaining
- Gains
- Gates
- High
- HTTPS
- in
- Increase
- index
- initial
- IT
- Level
- levels
- likely
- Low
- MACD
- major
- max-width
- might
- more
- move
- moving
- moving average
- Near
- NewsBTC
- next
- open
- Pace
- past
- plato
- Plato Data Intelligence
- PlatoData
- positive
- price
- protecting
- pump
- rallies
- relative strength index
- Resistance
- retracement
- rising
- rsi
- Signs
- similar
- Simple
- Source
- start
- started
- steady
- strength
- support
- support levels
- Supported
- test
- The
- to
- towards
- traded
- Trading
- TradingView
- Upside
- upward
- us
- US Dollar
- week
- which
- zephyrnet