BNB price (Binance coin) is consolidating below $250 against the US Dollar. The price could start a strong increase if it clears the $245 and $250 resistance levels.
- Binance coin price is struggling to gain pace above the $250 zone against the US Dollar.
- The price is now trading below $245 and the 100 simple moving average (4 hours).
- There was a break above a key bearish trend line with resistance near $240 on the 4-hour chart of the BNB/USD pair (data source from Binance).
- The pair might gain bullish momentum above $245 and $250.
Binance Coin Price Eyes Fresh Increase
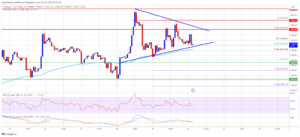
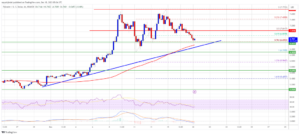
In the past few days, BNB price saw a couple of swing moves from $245. The bulls struggled to push the price above the $250 resistance. The price reacted to the downside a couple of times and tested the $235 support zone.
A low is formed near $253.6 and the price is attempting a fresh increase, unlike Bitcoin and Ethereum. There was a move above the $240 resistance. The price spiked above the 23.6% Fib retracement level of the downward move from the $262 swing high to the $235 low.
There was also a break above a key bearish trend line with resistance near $240 on the 4-hour chart of the BNB/USD pair. BNB price is now trading below $245 and the 100 simple moving average (4 hours).
On the upside, it is facing resistance near the $245 level. The next major resistance is near $250 or the 50% Fib retracement level of the downward move from the $262 swing high to the $235 low. A close above the $250 resistance might increase the chances of a push above the $255 resistance.
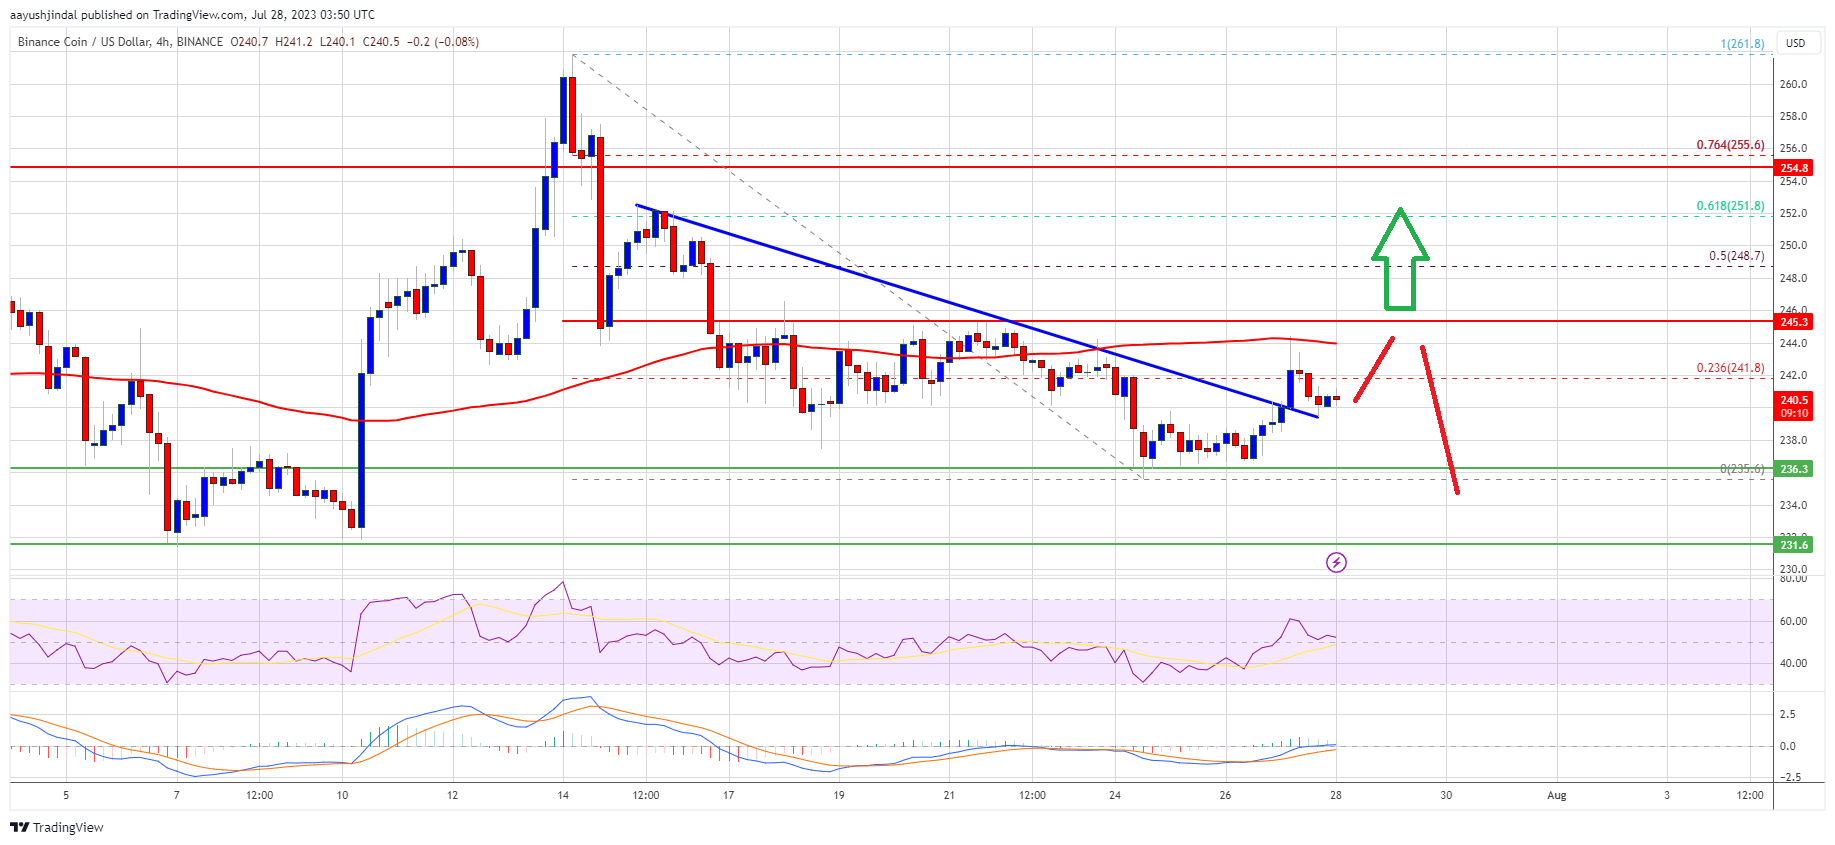
Source: BNBUSD on TradingView.com
A clear move above the $255 resistance might start a steady increase. The next major resistance is near the $262 level, above which the price might rise toward the $270 resistance.
Another Decline in BNB?
If BNB fails to clear the $245 resistance, it could start another decline. Initial support on the downside is near the $236 level.
The next major support is near the $232 level. If there is a downside break below the $232 support, the price could drop toward the $220 support. Any more losses could send the price toward the $212 support.
Technical Indicators
4-Hours MACD – The MACD for BNB/USD is losing pace in the bullish zone.
4-Hours RSI (Relative Strength Index) – The RSI for BNB/USD is currently above the 50 level.
Major Support Levels – $236, $232, and $220.
Major Resistance Levels – $245, $250, and $255.
- SEO Powered Content & PR Distribution. Get Amplified Today.
- PlatoData.Network Vertical Generative Ai. Empower Yourself. Access Here.
- PlatoAiStream. Web3 Intelligence. Knowledge Amplified. Access Here.
- PlatoESG. Automotive / EVs, Carbon, CleanTech, Energy, Environment, Solar, Waste Management. Access Here.
- BlockOffsets. Modernizing Environmental Offset Ownership. Access Here.
- Source: https://www.newsbtc.com/analysis/bnb/bnb-price-consolidates-below-250/
- :is
- 100
- 23
- 50
- a
- above
- against
- also
- and
- Another
- any
- attempting
- average
- bearish
- below
- binance
- Binance Coin
- bnb
- BNB Price
- BNB/USD
- Break
- Bullish
- Bulls
- chances
- Chart
- clear
- Close
- Coin
- Consolidates
- consolidating
- could
- Couple
- Currently
- data
- Days
- Decline
- Dollar
- downside
- downward
- Drop
- Eyes
- facing
- fails
- few
- For
- formed
- fresh
- fresh increase
- from
- Gain
- High
- HOURS
- HTTPS
- if
- in
- Increase
- index
- initial
- IT
- Key
- Level
- levels
- Line
- losing
- losses
- Low
- MACD
- major
- max-width
- might
- Momentum
- more
- move
- moves
- moving
- moving average
- Near
- NewsBTC
- next
- now
- of
- on
- or
- Pace
- pair
- past
- plato
- Plato Data Intelligence
- PlatoData
- price
- Push
- relative
- relative strength index
- Resistance
- retracement
- Rise
- rsi
- saw
- send
- Simple
- Source
- start
- steady
- strength
- strong
- Struggling
- support
- support levels
- Swing
- tested
- The
- There.
- times
- to
- toward
- Trading
- TradingView
- Trend
- trigger
- unlike
- Upside
- us
- US Dollar
- was
- What
- which
- with
- zephyrnet