Published 15 hours ago
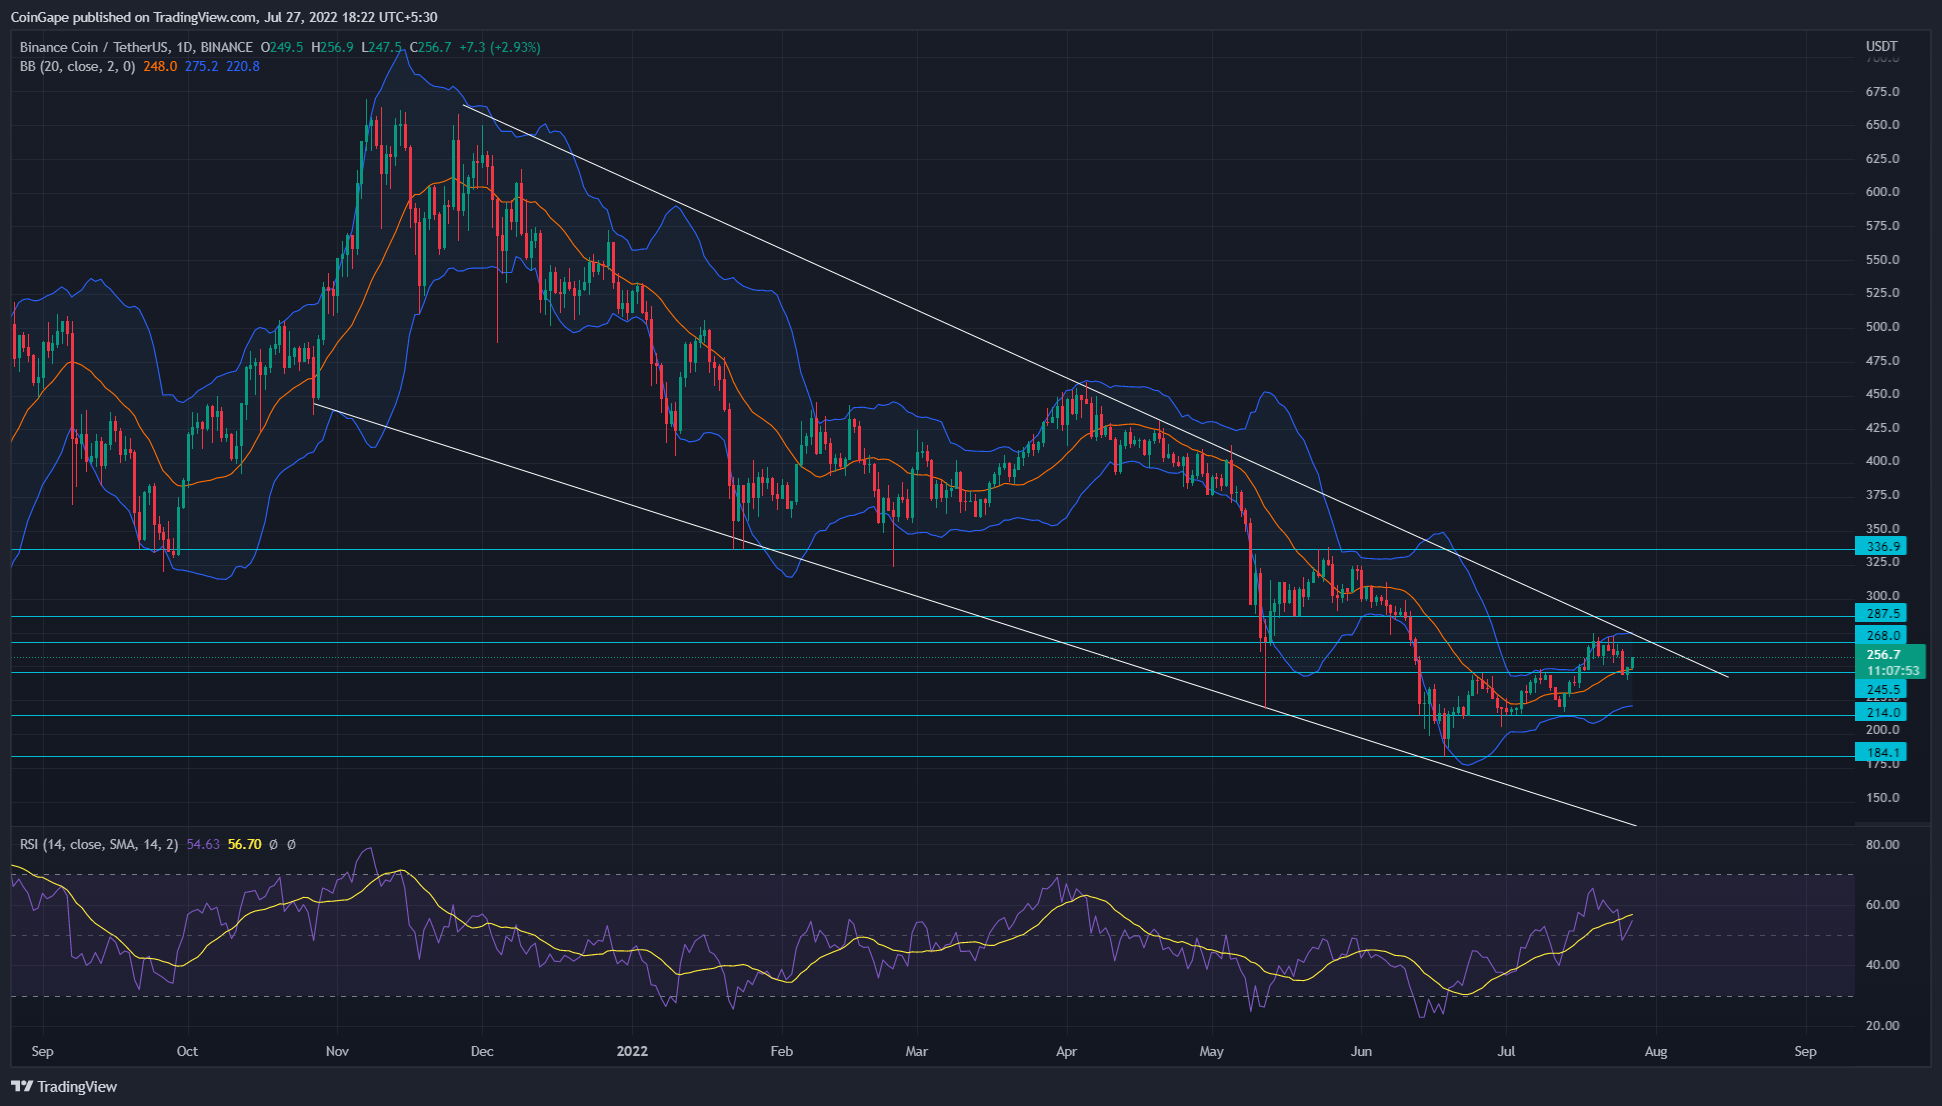
Since the crypto downtrend began in late November, the BNB/USDT pair has been lowering in a parallel channel pattern. This coin price has tested the trendline barriers of the pattern multiple times, indicating the traders respect its level. Thus, the coin holders should closely watch the price action at the resistance trendline before entering a new position.
advertisement
Key points
- The BNB price has surged 3.5% in the past two days.
- The coin price breached the 20-day EMA dynamic resistance.
- The intraday trading volume in the BNB price is $1.33 Billion, indicating a 5.47% loss.
Source-Tradingview
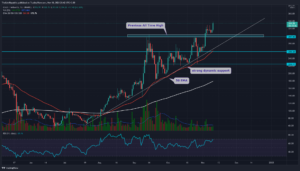
The latest bull cycle within the channel pattern was initiated when the BNB prices rebounded from the $184.5 low. The resulting recovery shaped into an ascending triangle pattern whose neckline breakout of $245 indicated the buyers are ready for another leg up.
The breakout rally reached a record high of $274.5, registering a 40% gain from the mentioned low. However, the BNB price reverted 11.4% amid the recent correction in the market and retested the breached neckline.
Trending Stories
If the BNB buyers sustain above the $245 flipped support, the post-retest rally would offset the retracement loss and rechallenge the $274.5 mark.
Furthermore, the descending trendline of parallel channel patterns situated at the same level validates it as a high area of interest. Thus, a bullish breakout from this resistance would be the first sign of trend reversal.
Moreover, the potential rally should first hit the $337 mark.
On a contrary note, if the BNB price reverts from the trendline resistance, the traders can expect the continuation of the prevailing downtrend and lead the coin to a June low of $184.
Technical indicator
RSI indicator: despite a correction, the RSI slope managed to sustain above the midline, indicating the market sentiment remains positive for BNB.
advertisement
Bollinger band indicator: the BNB price rebounded from the indicator’s midline, bolstering the breakout theory. Thus, this support should assist buyers in reaching the $274.5 mark.
- Resistance Levels: $268 and $287
- Support Levels: $244.5 and $214
Share this article on:
The presented content may include the personal opinion of the author and is subject to market condition. Do your market research before investing in cryptocurrencies. The author or the publication does not hold any responsibility for your personal financial loss.
- Binance_Coin price analysis
- Bitcoin
- blockchain
- blockchain compliance
- blockchain conference
- bnb
- coinbase
- Coingape
- coingenius
- Consensus
- crypto conference
- crypto mining
- cryptocurrency
- decentralized
- DeFi
- Digital Assets
- ethereum
- machine learning
- non fungible token
- plato
- plato ai
- Plato Data Intelligence
- Platoblockchain
- PlatoData
- platogaming
- Polygon
- Price Analysis
- proof of stake
- W3
- zephyrnet