Bitcoin price found support near $22,000 and started a consolidation phase. BTC is trading in a range and facing many hurdles near $22,600.
- Bitcoin is struggling to gain pace for a move above the $22,800 resistance zone.
- The price is trading below $22,650 and the 100 hourly simple moving average.
- There is a key bearish trend line forming with resistance near $22,620 on the hourly chart of the BTC/USD pair (data feed from Kraken).
- The pair could correct higher, but upsides might be limited above the $22,800 level.
Bitcoin Price Faces Hurdles
Bitcoin price started a major decline from well above the $23,200 support zone. BTC declined heavily below the $23,000 level and even traded below the $22,500 level.
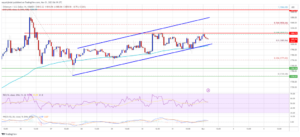
The price traded as low as $22,000 and recently started a minor upside correction. There was a minor increase above the $22,250 resistance zone. The price spiked above the 23.6% Fib retracement level of the downward wave from the $23,978 swing high to $22,000 low.
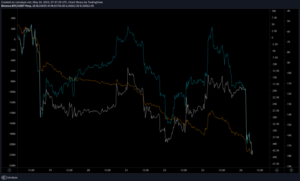
Bitcoin price is now trading below $22,650 and the 100 hourly simple moving average. There is also a key bearish trend line forming with resistance near $22,620 on the hourly chart of the BTC/USD pair.
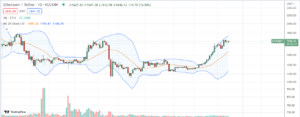
An immediate resistance is near the $22,600 zone and the trend line. The first major resistance is near the $22,800 zone. The main resistance is now near the $23,000 zone. It is close to the 50% Fib retracement level of the downward wave from the $23,978 swing high to $22,000 low.

Source: BTCUSD on TradingView.com
A clear move above the $23,000 resistance might start a steady increase towards the $23,500 resistance zone. The next key resistance is near the $23,220 zone, above which the price might gain bullish momentum.
Fresh Decline in BTC?
If bitcoin price fails to clear the $22,600 resistance and the trend line, it could start another decline. An immediate support on the downside is near the $22,200 zone.
The next major support is near the $22,000 zone, below which the bears might aim another sharp decline. The next major support is near the $21,200 level.
Technical indicators:
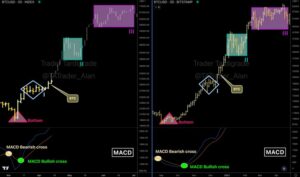
Hourly MACD – The MACD is now losing pace in the bearish zone.
Hourly RSI (Relative Strength Index) – The RSI for BTC/USD is now below the 30 level.
Major Support Levels – $22,200, followed by $22,000.
Major Resistance Levels – $22,620, $22,800 and $23,220.
- SEO Powered Content & PR Distribution. Get Amplified Today.
- Platoblockchain. Web3 Metaverse Intelligence. Knowledge Amplified. Access Here.
- Source: https://www.newsbtc.com/analysis/btc/bitcoin-price-turns-red-23k/
- :is
- 000
- 100
- a
- above
- and
- Another
- AS
- average
- BE
- bearish
- Bears
- below
- Bitcoin
- Bitcoin Price
- BTC
- BTC/USD
- Bullish
- by
- Chart
- clear
- Close
- consolidation
- could
- data
- Decline
- downside
- downward
- Even
- faces
- facing
- fails
- First
- followed
- For
- found
- from
- Gain
- heavily
- High
- higher
- HTTPS
- Hurdles
- immediate
- in
- Increase
- index
- Indicators
- IT
- Key
- key resistance
- Kraken
- Level
- levels
- Limited
- Line
- losing
- Low
- MACD
- Main
- major
- many
- max-width
- might
- minor
- Momentum
- move
- moving
- moving average
- Near
- NewsBTC
- next
- of
- on
- Pace
- phase
- plato
- Plato Data Intelligence
- PlatoData
- price
- range
- recently
- Red
- relative strength index
- Resistance
- retracement
- rsi
- sharp
- Simple
- start
- started
- steady
- strength
- Struggling
- support
- support levels
- The
- to
- towards
- traded
- Trading
- TradingView
- Trend
- trigger
- Upside
- Wave
- WELL
- What
- which
- with
- zephyrnet