Published 15 seconds ago
On May 12th, the Bitcoin price showcased a breakdown attempt from the monthly support of $27000-$26786. However, by the day’s end, the daily candle surged back above the aforementioned support with closing, indicating the buyers continue to defend this support level. As a result, the coin price rose 2.5% in the last three days and reached the current price of $27456. However, is this reversal enough to resume the prior recovery rally in BTC?
advertisement
Key Points:
- A Bitcoin price needs a breakout above the resistance trendline will assist buyers to kickstart recovery.
- The 100-day EMA nearing $27000 will increase the support strength of this level
- The intraday trading volume in Bitcoin is $13.3 Billion, indicating a 44% gain.
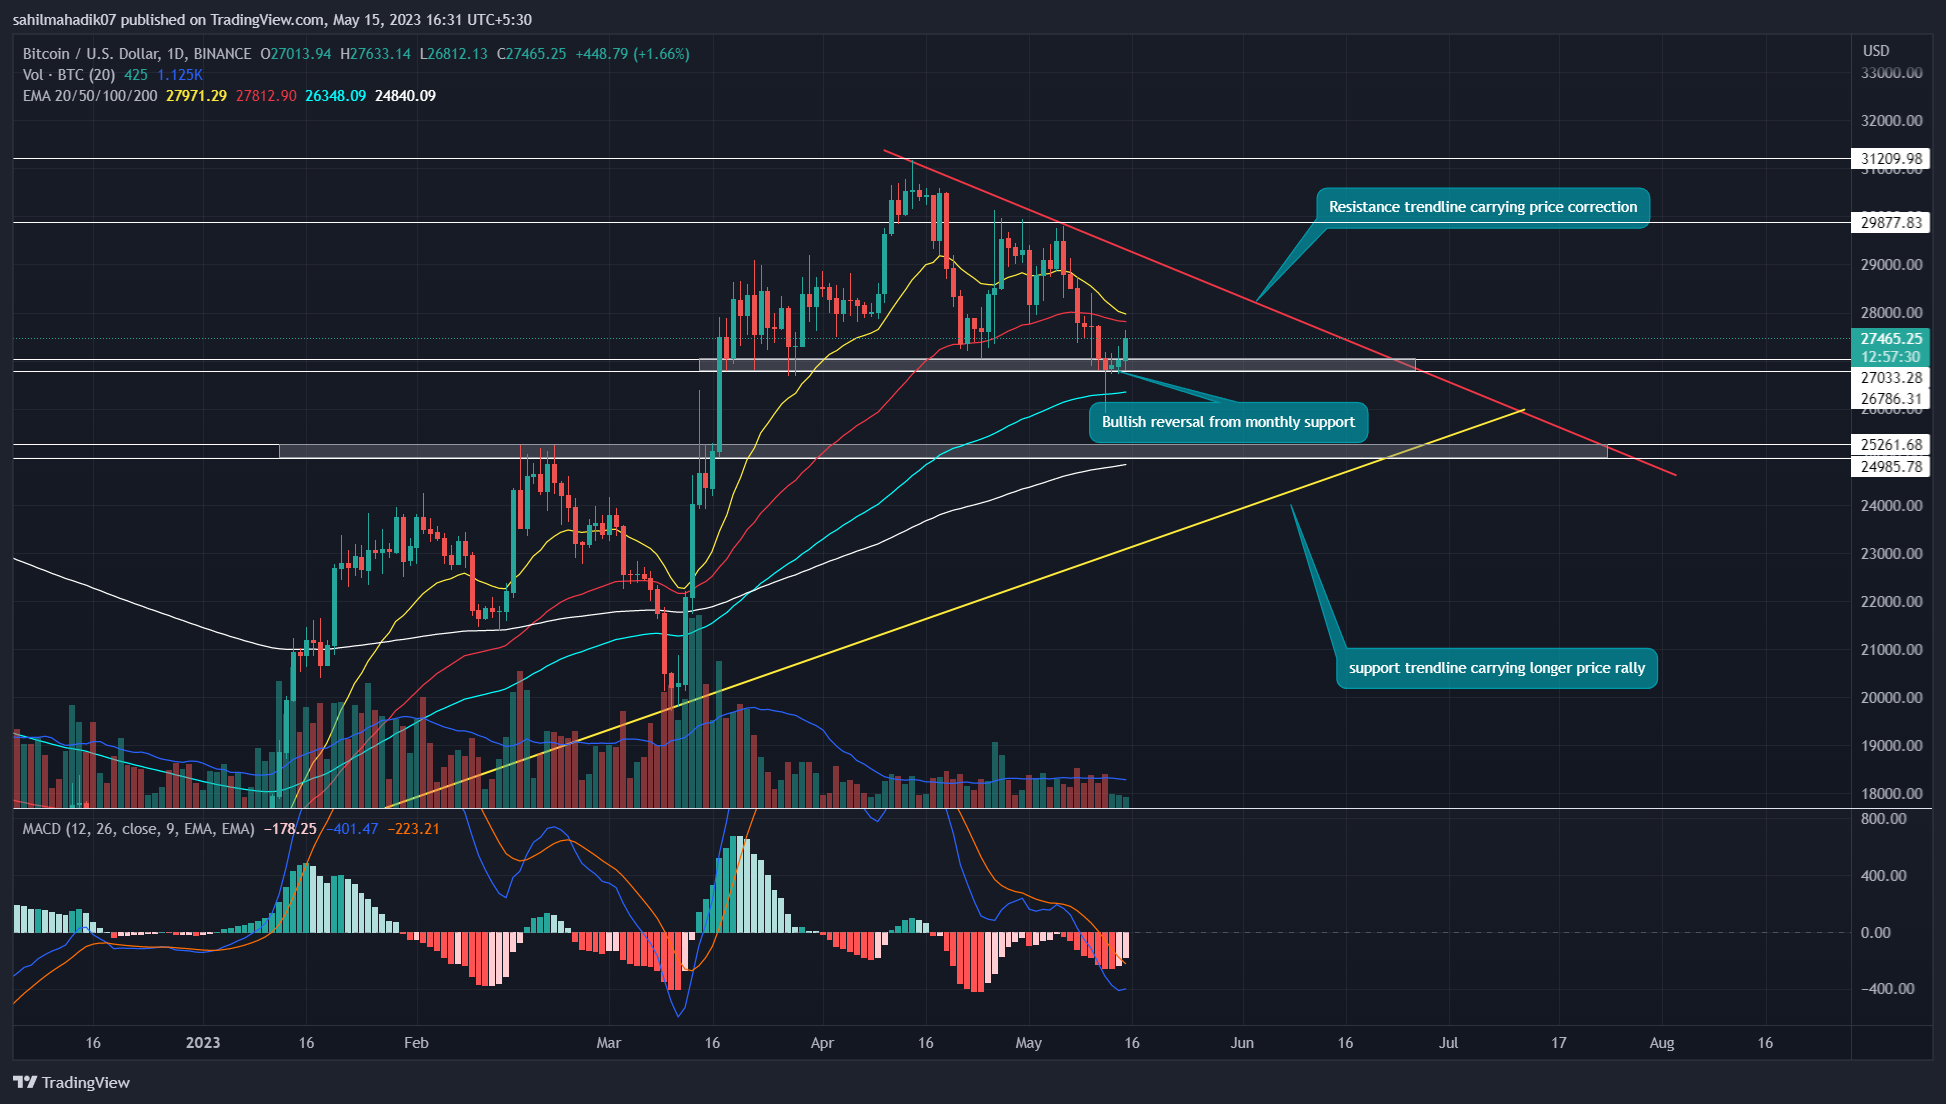
Source-Tradingview
Over the past two months, the Bitcoin price witnessed its fourth reversal from the $27000-$26786 support indicating that traders are aggressively accumulating at this level. This reversal hints at a potential upswing for a week, which could push the price to overhead resistance.
Thus, the potential rally may surge the price by 5% and hit the overhead resistance trendline(red trendline). This resistance trendline is leading the ongoing correction in the world’s largest cryptocurrency offering sellers the opportunity to sell on bullish rallies.
Trending Stories
Also Read: Top BRC – 20 Tokens Set To Take The Next Big Leap
Therefore, a breakout above the overhead trendline is crucial for Bitcoin buyers to resume the price recovery phase.
On a contrary note, if the coin price shows a reversal sign at the falling trendline, the BTC holders could experience a long correction phase.
Technical Indicator
Exponential Moving Average: A potential bearish crossover between the 20-and-50-day EMA could put additional selling pressure on the BTC price.
Moving Average Convergence/Divergence: An uptick in MACD(blue) and signal(orange) line may encourage a temporary recovery but these slopes below the midline reflect a bearish trend.
Bitcoin Price Intraday Levels
- Spot rate: $27465
- Trend: Bullish
- Volatility: Medium
- Resistance levels- $30000 and $31200
- Support levels- $27000 and $25200
Share this article on:
advertisement
The presented content may include the personal opinion of the author and is subject to market condition. Do your market research before investing in cryptocurrencies. The author or the publication does not hold any responsibility for your personal financial loss.
- SEO Powered Content & PR Distribution. Get Amplified Today.
- PlatoAiStream. Web3 Data Intelligence. Knowledge Amplified. Access Here.
- Minting the Future w Adryenn Ashley. Access Here.
- Buy and Sell Shares in PRE-IPO Companies with PREIPO®. Access Here.
- Source: https://coingape.com/markets/bitcoin-price-reversal-from-monthly-support-hints-5-rise-but-theres-a-catch/
- :is
- :not
- 1
- 10
- 12
- 14
- 15%
- 20
- 200
- 7
- 8
- 9
- a
- above
- Ad
- Additional
- ago
- am
- and
- any
- ARE
- article
- AS
- assist
- At
- author
- avatar
- average
- back
- bearish
- Beauty
- before
- below
- between
- Big
- Billion
- Bitcoin
- Bitcoin Price
- blockchain
- Blue
- Breakdown
- breakout
- Brian
- BTC
- btc price
- Bullish
- but
- buyers
- by
- Catch
- closing
- Coin
- Coingape
- COM
- condition
- content
- continue
- contrary
- correction phase
- could
- crucial
- cryptocurrencies
- cryptocurrency
- Current
- daily
- Days
- different
- do
- does
- EMA
- encourage
- end
- enough
- Entertainment
- Ether (ETH)
- experience
- Falling
- Fashion
- finance
- financial
- follow
- For
- Fourth
- from
- Gain
- Have
- hints
- Hit
- hold
- holders
- However
- HTTPS
- i
- if
- in
- include
- Including
- Increase
- indicating
- investing
- ITS
- journalism
- jpg
- largest
- Last
- leading
- Level
- Line
- Long
- loss
- Market
- market research
- May..
- monthly
- months
- moving
- moving average
- nearing
- needs
- next
- of
- offering
- on
- ongoing
- Opinion
- Opportunity
- or
- Orange
- out
- past
- personal
- phase
- plato
- Plato Data Intelligence
- PlatoData
- plugin
- points
- potential
- presented
- pressure
- price
- Prior
- Publication
- Push
- put
- rallies
- rally
- Rate
- reach
- reached
- Read
- recovery
- Red
- reflect
- research
- Resistance
- responsibility
- result
- resume
- Reversal
- Rise
- ROSE
- seconds
- sell
- Sellers
- Selling
- set
- Share
- showcased
- Shows
- sign
- strength
- subject
- support
- support level
- surge
- Surged
- Take
- temporary
- that
- The
- These
- this
- three
- to
- Tokens
- Topics
- Traders
- Trading
- trading volume
- TradingView
- Trend
- trending
- two
- variety
- volume
- week
- which
- will
- with
- witnessed
- working
- world’s
- written
- years
- Your
- zephyrnet