Bitcoin Price Prediction – June 14
According to the daily chart, the Bitcoin bulls are working hard to foster an uptrend after the coin touches the support at $38,744.
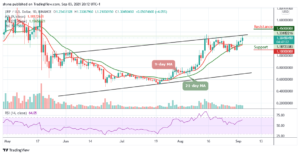
BTC/USD Long-term Trend: Bearish (Daily Chart)
Key levels:
Resistance Levels: $46,000, $48,000, $50,200
Support Levels: $34,000, $32,000, $30,000

BTC/USD is currently trading 1.61% higher on the day. The Bitcoin price opened the session at $39,015 and now adjusting upwards to the prevailing market value of $40,000. The first digital asset moves within the short-term uptrend with low volatility. However, the current conditions imply that as the coin moves above the 9-day and 21-day moving averages, the price may remain in range for the next few trading hours. Meanwhile, the technical indicator Relative Strength Index (14) is crossing above 50-level.
Bitcoin Price Prediction: Would Bitcoin Price Close Above $40,000?
As the market opens today, after testing the low of $38,744, the Bitcoin price is currently hovering around $39,642. Meanwhile, the market is likely to pull back or sell shortly after hitting the crucial resistance level of $41,000, and traders could see $39,000 to $38,000 being tested again before climbing.
On the downside, if the market decides to fall, the Bitcoin price could fall below the 9-day and 21-day moving averages at $35,000, and if that support fails to hold the downtrend, BTC/USD could experience a further decline towards the support levels of $34,000, $32,000, and critically $30,000. All the same, any further bullish movement towards the upper boundary of the channel may hit the resistances at $46,000, $48,000, and $50,000.
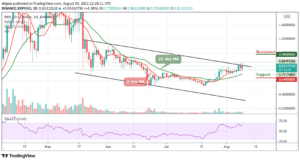
BTC/USD Medium – Term Trend: Ranging (4H Chart)
On the 4-hour chart, we expect the coin to gain the lost momentum and hit the trade above $40,800. Meanwhile, as the volatility hovers, the selling pressure still exists and this could lead the coin not to be able to cross above the upper boundary of the channel. Meanwhile, the $38,000 and below may come into play if BTC breaks below 9-day and 21-day moving averages.

However, in as much as buyers can still reinforce and power the market, traders can expect a cross above the channel, and breaking this barrier may further allow the bulls to reach $42,000 and above. The technical indicator Relative Strength Index (14) is seen trading around 64-level which shows that the market may likely trade sideways.
Looking to buy or trade Bitcoin (BTC) now? Invest at eToro!
75% of retail investor accounts lose money when trading CFDs with this provider
Source: https://insidebitcoins.com/news/bitcoin-price-prediction-btc-usd-stabilizes-above-39500
- 000
- All
- around
- asset
- bearish
- Bitcoin
- Bitcoin Price
- Bitcoin price prediction
- BTC
- BTC/USD
- Bullish
- Bulls
- buy
- Coin
- Current
- day
- digital
- Digital Asset
- First
- hold
- HTTPS
- index
- investor
- lead
- Level
- Market
- medium
- Momentum
- money
- opens
- power
- prediction
- pressure
- price
- Price Prediction
- range
- retail
- sell
- support
- Technical
- Testing
- trade
- Traders
- Trading
- value
- Volatility
- within