Bitcoin (BTC) has corrected to below $26,000 following an unsuccessful attempt to breach the $30,000 mark, widely regarded as a critical resistance point for initiating a new bull run. Recent price movements have left some analysts pondering the cryptocurrency’s uncertain future.
In particular, in a series of posts on TradingView, a crypto analyst by the pseudonym Tolberti expressed on September 3 that Bitcoin’s recent surge and price drop could potentially be a ‘bull trap’ of the year.
He pointed out that the current Bitcoin chart appears to form a significant head and shoulders pattern—an indicator typically associated with bearish trends.
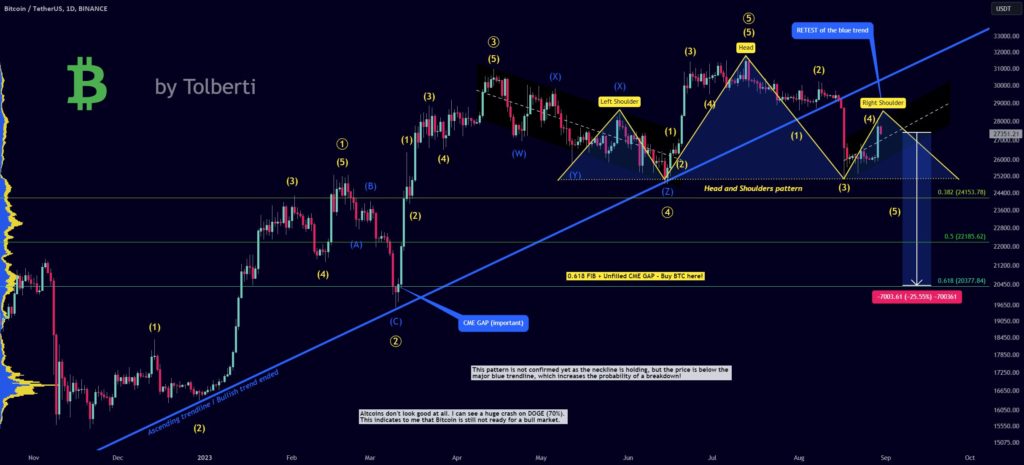
“Bitcoin pumped significantly, but it’s definitely a bull trap, so do not fall for it! We can see that the chart is printing a huge head and shoulders pattern, which is a very bearish sign. This pattern is not confirmed yet as the neckline is holding, but the price is below the major blue trendline, which increases the probability of a breakdown!,” he said.
In his view, this shift in the trend from bullish to bearish presents an opportunity for traders to take a short position on Bitcoin. The analyst identified specific price levels that he believes could offer attractive entry points for traders.
“Where to take profit or buy Bitcoin? I strongly recommend the 0.618 FIB ($20,377) retracement in confluence with the CME unfilled GAP. This is an extremely strong support, and we should see the start of a new bull market or at least a significant bounce from it,” he added.
Bitcoin’s readiness for a bull run
However, the analyst cautioned that Bitcoin is not yet prepared for a full-fledged bull market and has presented several key indicators to support his bearish stance. One notable indicator he highlighted is Bitcoin trading below the 200-weekly moving average (MA), which traditionally signifies prolonged bearish sentiment. Notably, he suggested that the leading cryptocurrency could potentially plummet to $10,000, with a reversal possibly taking place as early as March 2024.
Furthermore, he acknowledged that Bitcoin recently exhibited an impulse wave after a significant market crash, typically considered a bearish signal. Nevertheless, he posited that a bullish correction might precede another substantial downturn, adding an additional layer of uncertainty to Bitcoin’s future price trajectory.
It’s essential to note that Bitcoin has corrected to more typical territory around the $26,000 level after experiencing mid-week gains fueled by positive regulatory news. Bitcoin witnessed a notable surge of nearly 8%, reaching over $28,000 on Tuesday.
This surge followed a federal appeals court’s decision instructing the Securities and Exchange Commission (SEC) to reconsider its prior rejection of Grayscale Investments’ request to convert its GBTC into an Exchange-Traded Fund (ETF). Consistent with recent patterns, the cryptocurrency swiftly retraced a significant portion of these gains.
Indeed, cryptocurrency enthusiasts argue that the approval of a Bitcoin spot ETF could serve as a significant price catalyst for Bitcoin. Notably, this product, set to be the first of its kind in the U.S., is seen as a key driver of institutional capital inflow into the broader crypto market.
However, some market analysts caution that the hype surrounding an ETF approval should be tempered, as it is not a guaranteed path to a rally in Bitcoin’s price.
Bitcoin price analysis
At the time of writing, Bitcoin was trading at $25,903, registering a modest 0.45% gain over the last 24 hours. On the weekly chart, Bitcoin’s movements have been relatively minimal, with a decline of approximately 0.61%.

A review of Bitcoin’s technical analysis reveals that bearish sentiments currently dominate the cryptocurrency. A summary of the one-day indicators from TradingView shows a ‘sell’ recommendation at 14 while moving averages suggest a ‘strong sell’ at 13. Oscillators, on the other hand, recommend a ‘neutral’ stance at 8.

As Bitcoin continues to display a stagnant growth pattern, market observers are closely monitoring other potential catalysts, including the upcoming 2024 halving event, macroeconomic factors, and regulatory developments.
Disclaimer: The content on this site should not be considered investment advice. Investing is speculative. When investing, your capital is at risk.
Source: https://finbold.com/bitcoin-price-prediction-as-btc-faces-bull-trap-of-the-year/
- SEO Powered Content & PR Distribution. Get Amplified Today.
- PlatoData.Network Vertical Generative Ai. Empower Yourself. Access Here.
- PlatoAiStream. Web3 Intelligence. Knowledge Amplified. Access Here.
- PlatoESG. Automotive / EVs, Carbon, CleanTech, Energy, Environment, Solar, Waste Management. Access Here.
- PlatoHealth. Biotech and Clinical Trials Intelligence. Access Here.
- ChartPrime. Elevate your Trading Game with ChartPrime. Access Here.
- BlockOffsets. Modernizing Environmental Offset Ownership. Access Here.
- Source: https://bitcoinethereumnews.com/bitcoin/bitcoin-price-prediction-as-btc-faces-bull-trap-of-the-year/?utm_source=rss&utm_medium=rss&utm_campaign=bitcoin-price-prediction-as-btc-faces-bull-trap-of-the-year
- :has
- :is
- :not
- 000
- 13
- 14
- 2024
- 24
- 8
- a
- acknowledged
- added
- adding
- Additional
- advice
- After
- an
- analysis
- analyst
- Analysts
- and
- Another
- appeals
- approval
- approximately
- ARE
- argue
- around
- AS
- associated
- At
- attractive
- auto
- average
- BE
- bearish
- been
- believes
- below
- Bitcoin
- Bitcoin Price
- Bitcoin price prediction
- Bitcoin spot etf
- bitcoin trading
- blockchain
- Blue
- Bounce
- breach
- broader
- BTC
- bull
- Bull Market
- Bull Run
- bull trap
- Bullish
- but
- buy
- buy bitcoin
- by
- CAN
- capital
- Catalyst
- catalysts
- caution
- Chart
- closely
- CME
- commission
- CONFIRMED
- considered
- consistent
- content
- continues
- convert
- corrected
- could
- Crash
- critical
- crypto
- crypto analyst
- Crypto Market
- cryptocurrency
- Current
- Currently
- decision
- Decline
- definitely
- developments
- Display
- do
- dominate
- DOWNTURN
- driver
- Drop
- Early
- enthusiasts
- entry
- essential
- ETF
- Event
- exchange
- Exchange Commission
- exchange-traded
- exchange-traded fund (ETF)
- experiencing
- expressed
- extremely
- faces
- factors
- Fall
- Federal
- First
- fluid
- followed
- following
- For
- form
- from
- fueled
- full-fledged
- fund
- future
- Future Price
- Gain
- Gains
- gap
- GBTC
- Grayscale
- Growth
- guaranteed
- Halving
- hand
- Have
- he
- head
- Highlighted
- his
- holding
- HOURS
- HTTPS
- huge
- Hype
- i
- identified
- in
- Including
- Increases
- Indicator
- Indicators
- initiating
- Institutional
- into
- investing
- investment
- IT
- ITS
- jpg
- Key
- Kind
- Last
- layer
- leading
- least
- left
- Level
- levels
- Macroeconomic
- major
- March
- March 2024
- mark
- Market
- market crash
- max-width
- might
- minimal
- modest
- monitoring
- more
- movements
- moving
- moving average
- moving averages
- nearly
- Nevertheless
- New
- news
- notable
- notably
- note
- observers
- of
- offer
- on
- ONE
- Opportunity
- or
- Other
- out
- over
- particular
- path
- Pattern
- patterns
- Place
- plato
- Plato Data Intelligence
- PlatoData
- Plummet
- Point
- points
- position
- positive
- possibly
- Posts
- potential
- potentially
- prediction
- prepared
- presented
- presents
- price
- Price Analysis
- price chart
- Price Prediction
- printing
- Prior
- probability
- Product
- Profit
- rally
- reaching
- Readiness
- recent
- recently
- recommend
- Recommendation
- reconsider
- regarded
- registering
- regulatory
- Regulatory news
- relatively
- request
- Resistance
- retracement
- Reveals
- Reversal
- review
- Risk
- Run
- s
- Said
- SEC
- Securities
- Securities and Exchange Commission
- see
- seen
- sentiment
- sentiments
- September
- Series
- serve
- set
- several
- shift
- Short
- should
- Shows
- sign
- Signal
- significant
- significantly
- signifies
- site
- So
- some
- Source
- specific
- speculative
- Spot
- spot etf
- start
- strong
- strongly
- substantial
- suggest
- SUMMARY
- support
- surge
- Surrounding
- swiftly
- Take
- taking
- Technical
- Technical Analysis
- territory
- that
- The
- The Weekly
- These
- this
- time
- to
- Traders
- Trading
- traditionally
- trajectory
- Trend
- Trends
- true
- Tuesday
- typical
- typically
- u.s.
- Uncertain
- Uncertainty
- upcoming
- very
- View
- was
- Wave
- we
- weekly
- when
- which
- while
- widely
- with
- witnessed
- writing
- year
- yet
- Your
- zephyrnet


![Tron [TRX]: Will new upgrade foster stagnant staking activity? Gauging…](https://platoaistream.com/wp-content/uploads/2023/03/tron-trx-will-new-upgrade-foster-stagnant-staking-activity-gauging-300x153.jpg)