Bitcoin price is holding the key $26,550 support zone. BTC could start a major decline if there is a close below $26,550 and $26,400.
- Bitcoin started another decline and traded below the $26,850 level.
- The price is trading below $27,000 and the 100 hourly Simple moving average.
- There is a major bearish trend line forming with resistance near $27,120 on the hourly chart of the BTC/USD pair (data feed from Kraken).
- The pair could gain bearish momentum if there is a daily close below $26,550.
Bitcoin Price Remains In A Range
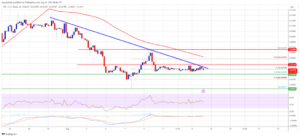
Bitcoin price started a fresh decline below the $27,000 level. BTC traded below the $26,800 support zone and trimmed most of its gains. However, the bulls were active near the $26,550 support.
A low is formed near $26,536 and the price is now consolidating losses. It is clearly showing bearish signs below $27,000 and the 100 hourly Simple moving average. There is also a major bearish trend line forming with resistance near $27,120 on the hourly chart of the BTC/USD pair.
Bitcoin price is now facing resistance near the $26,720 level. It is close to the 23.6% Fib retracement level of the recent decline from the $27,268 swing high to the $26,536 low.
The next major resistance is near the $27,000 level and the 100 hourly Simple moving average. It is close to the 61.8% Fib retracement level of the recent decline from the $27,268 swing high to the $26,536 low. The first major resistance is near the trend line.
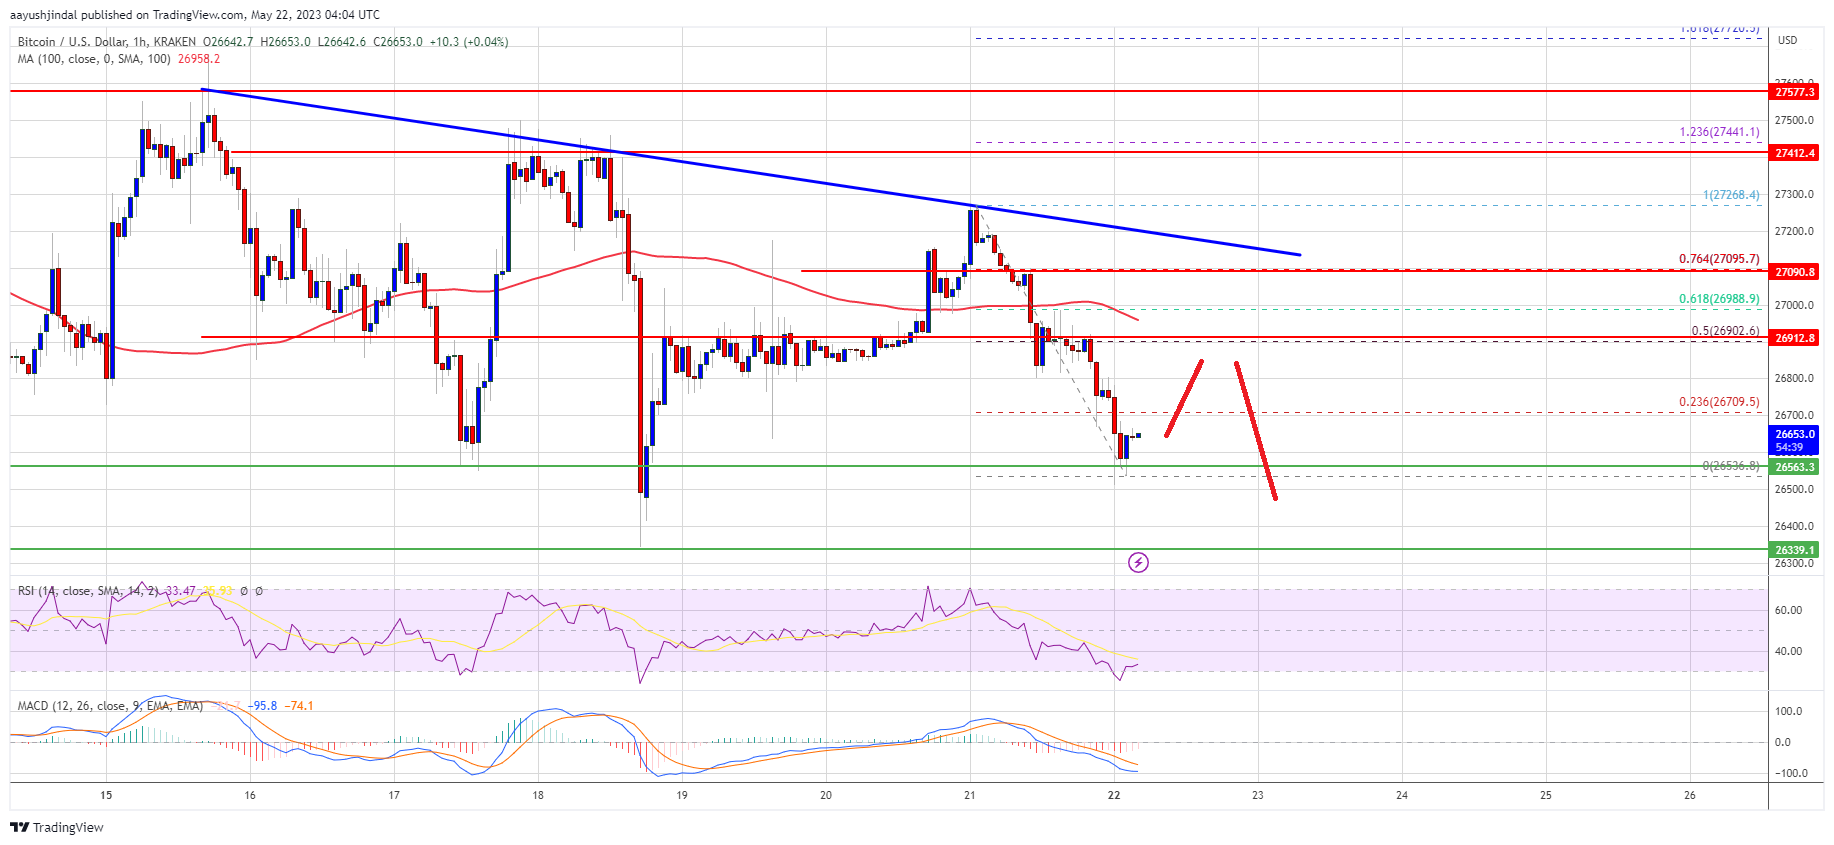
Source: BTCUSD on TradingView.com
A close above the $27,120 resistance might reduce selling pressure. The next key resistance is near $27,550, above which the price might start a decent increase toward the $28,000 resistance. Any more gains might send the price toward the $28,500 level.
More Losses in BTC?
If Bitcoin’s price fails to clear the $27,120 resistance, it could continue to move down. Immediate support on the downside is near the $26,550 level.
The next major support is near the $26,350 zone, below which the price might gain bearish momentum. In the stated case, it could test the $25,800 level. Any more losses might take Bitcoin toward the $25,500 level in the near term.
Technical indicators:
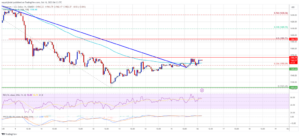
Hourly MACD – The MACD is now gaining pace in the bearish zone.
Hourly RSI (Relative Strength Index) – The RSI for BTC/USD is now below the 50 level.
Major Support Levels – $26,550, followed by $26,350.
Major Resistance Levels – $27,000, $27,120, and $27,500.
- SEO Powered Content & PR Distribution. Get Amplified Today.
- PlatoAiStream. Web3 Data Intelligence. Knowledge Amplified. Access Here.
- Minting the Future w Adryenn Ashley. Access Here.
- Buy and Sell Shares in PRE-IPO Companies with PREIPO®. Access Here.
- Source: https://www.bitcoinnewsminer.com/bitcoin-price-holds-support-but-bears-are-still-in-control/
- :is
- 000
- 100
- 23
- 50
- 500
- a
- above
- active
- also
- and
- Another
- any
- ARE
- average
- bearish
- Bearish Momentum
- bearish signs
- Bears
- below
- Bitcoin
- Bitcoin Price
- BTC
- BTC/USD
- Bulls
- but
- by
- case
- Chart
- clear
- clearly
- Close
- consolidating
- continue
- control
- could
- daily
- data
- Decline
- down
- downside
- facing
- fails
- First
- followed
- For
- formed
- from
- Gain
- gaining
- Gains
- High
- holding
- holds
- However
- HTTPS
- if
- immediate
- in
- Increase
- index
- Indicators
- IT
- ITS
- Key
- key resistance
- Kraken
- Level
- levels
- Line
- losses
- Low
- MACD
- major
- max-width
- might
- Momentum
- more
- most
- move
- moving
- moving average
- Near
- NewsBTC
- next
- now
- of
- on
- Pace
- pair
- plato
- Plato Data Intelligence
- PlatoData
- pressure
- price
- recent
- reduce
- relative strength index
- remains
- Resistance
- retracement
- rsi
- Selling
- send
- Signs
- Simple
- start
- started
- stated
- Still
- strength
- support
- support levels
- Swing
- Take
- term
- test
- The
- There.
- to
- toward
- traded
- Trading
- TradingView
- Trend
- were
- which
- with
- zephyrnet