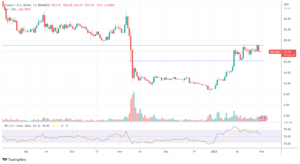
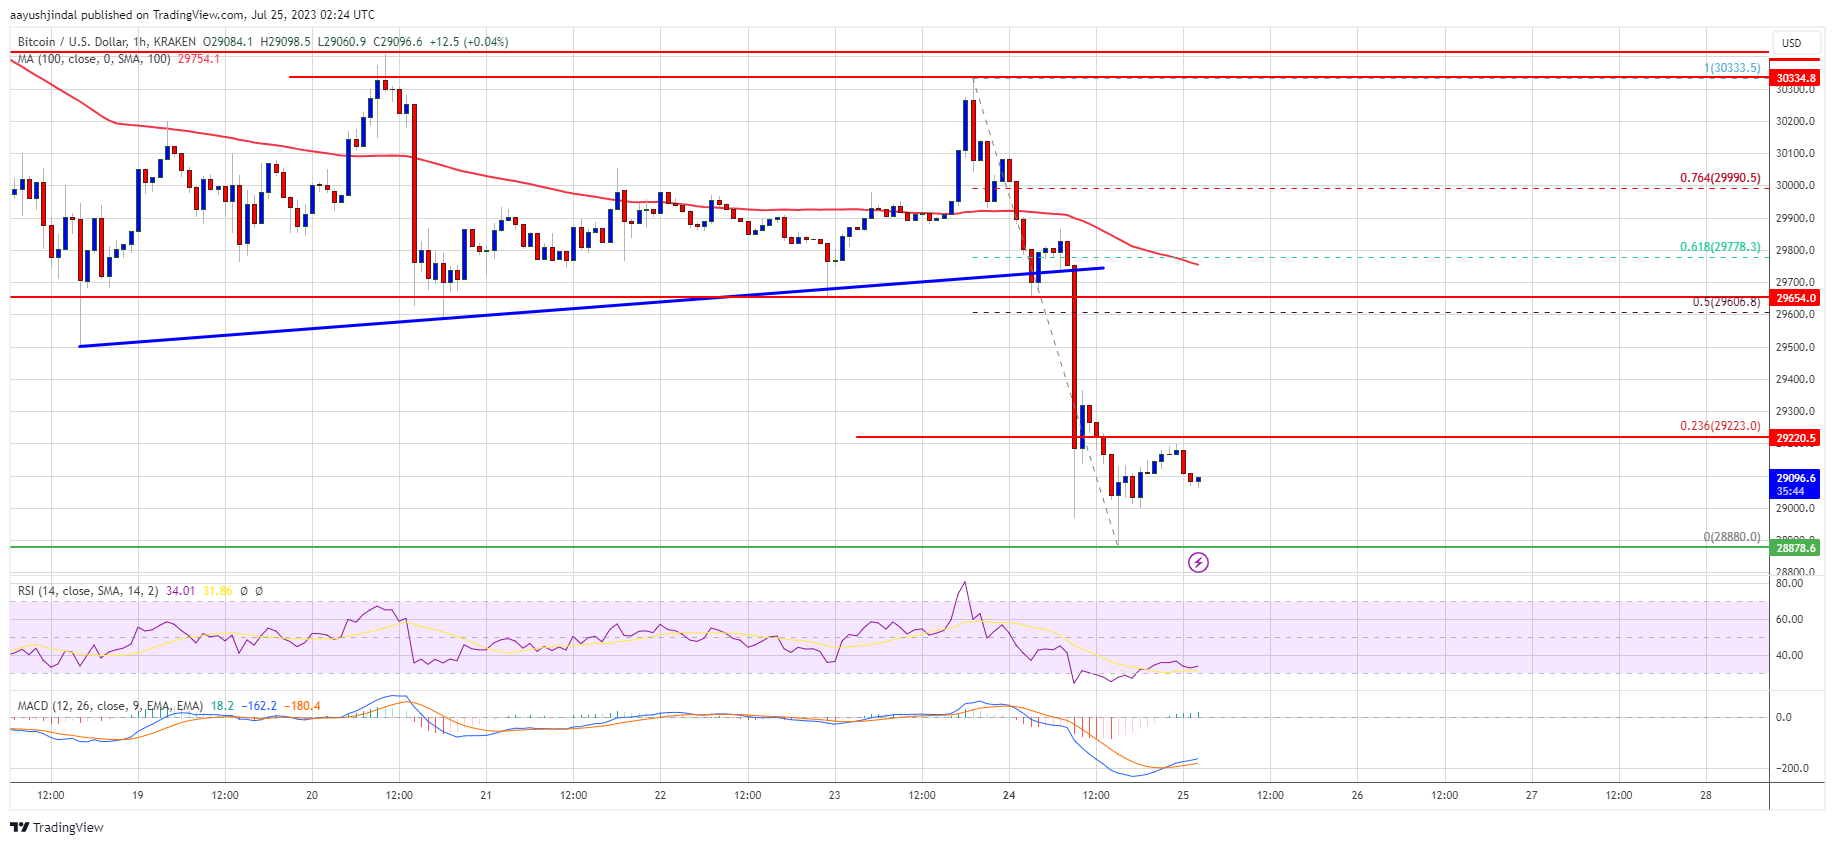
Bitcoin price extended its decline and traded below $29,000. BTC is still at risk of more downsides toward the $28,200 support zone in the near term.
- Bitcoin is gaining bearish momentum below the $29,200 level.
- The price is trading below $29,500 and the 100 hourly Simple moving average.
- There was a break below a major bullish trend line with support near $29,700 on the hourly chart of the BTC/USD pair (data feed from Kraken).
- The pair could extend its decline toward the $28,200 support zone.
Bitcoin Price Turns Red
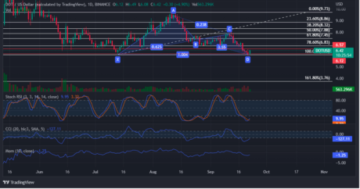
Bitcoin price settled below the $30,000 support zone to move into a bearish zone. BTC even broke the key $29,650 support zone to start a fresh decline.
Besides, there was a break below a major bullish trend line with support near $29,700 on the hourly chart of the BTC/USD pair. The pair tested the $28,880 level. A new weekly low is formed near $28,880 and the price is now consolidating losses.
Bitcoin is trading below $29,500 and the 100 hourly Simple moving average. Immediate resistance is near the $29,250 level. It is close to the 23.6% Fib retracement level of the recent decline from the $30,333 swing high to the $28,880 low.
The first major resistance is near the $29,750 level and the 100 hourly Simple moving average. It is near the 61.8% Fib retracement level of the recent decline from the $30,333 swing high to the $28,880 low.
Source: BTCUSD on TradingView.com
The next major resistance is near the $30,000 level. A close above the $30,000 level might start a fresh increase. In the stated case, the price could rise toward the $30,400 resistance. Any more gains could open the doors for a move toward the $30,850 resistance zone.
More Losses in BTC?
If Bitcoin fails to clear the $29,250 resistance, it could continue to move down. Immediate support on the downside is near the $28,880 level.
The next major support is near the $28,500 level, below which the price could struggle to recover. The next support is near the $28,200 level. Any more losses might call for a move toward the $27,500 level in the near term.
Technical indicators:
Hourly MACD – The MACD is now gaining pace in the bearish zone.
Hourly RSI (Relative Strength Index) – The RSI for BTC/USD is now below the 50 level.
Major Support Levels – $28,880, followed by $28,200.
Major Resistance Levels – $29,250, $29,750, and $30,000.
- SEO Powered Content & PR Distribution. Get Amplified Today.
- PlatoData.Network Vertical Generative Ai. Empower Yourself. Access Here.
- PlatoAiStream. Web3 Intelligence. Knowledge Amplified. Access Here.
- PlatoESG. Automotive / EVs, Carbon, CleanTech, Energy, Environment, Solar, Waste Management. Access Here.
- BlockOffsets. Modernizing Environmental Offset Ownership. Access Here.
- Source: https://www.newsbtc.com/analysis/btc/bitcoin-price-hits-bearish-target-28800/
- :is
- :not
- 000
- 100
- 200
- 23
- 250
- 50
- 500
- a
- above
- and
- any
- ARE
- At
- average
- bearish
- Bearish Momentum
- Bears
- below
- Bitcoin
- Bitcoin Price
- Break
- Broke
- BTC
- BTC/USD
- Bullish
- but
- by
- call
- case
- Chart
- clear
- Close
- consolidating
- continue
- could
- data
- Decline
- done
- doors
- down
- downside
- downsides
- Even
- extend
- fails
- First
- followed
- For
- formed
- fresh
- fresh increase
- from
- gaining
- Gains
- High
- Hits
- HTTPS
- immediate
- in
- Increase
- index
- Indicators
- into
- IT
- ITS
- Key
- Kraken
- Level
- levels
- Line
- losses
- Low
- MACD
- major
- max-width
- might
- Momentum
- more
- move
- moving
- moving average
- Near
- New
- NewsBTC
- next
- now
- of
- on
- open
- Pace
- pair
- plato
- Plato Data Intelligence
- PlatoData
- price
- recent
- Recover
- relative
- relative strength index
- Resistance
- retracement
- Rise
- Risk
- rsi
- Settled
- Simple
- start
- stated
- Still
- strength
- Struggle
- support
- support levels
- Swing
- Target
- term
- tested
- The
- There.
- to
- toward
- traded
- Trading
- TradingView
- Trend
- turns
- was
- weekly
- which
- with
- yet
- zephyrnet