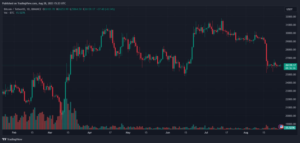
Bitcoin price is consolidating above the $25,500 level. BTC could start a decent increase if there is a close above the $27,000 resistance.
- Bitcoin is struggling to clear the $26,500 resistance zone.
- The price is trading near $26,100 and the 100 hourly Simple moving average.
- There was a break below a connecting bullish trend line with support near $26,400 on the hourly chart of the BTC/USD pair (data feed from Kraken).
- The pair could continue to trade in a range before the next major move.
Bitcoin Price Slides Again
Bitcoin price started a recovery wave above the $26,250 resistance level. BTC even cleared the $26,500 level but the bears were active near the $26,750 zone.
A high was formed near $26,779 and the price started a fresh decline. There was a move below the $26,500 level. The price declined below the 50% Fib retracement level of the recovery move from the $25,360 swing low to the $26,779 high.
Besides, there was a break below a connecting bullish trend line with support near $26,400 on the hourly chart of the BTC/USD pair. The pair tested the 61.8% Fib retracement level of the recovery move from the $25,360 swing low to the $26,779 high.
Bitcoin is trading near $26,100 and the 100 hourly Simple moving average. On the upside, immediate resistance is near the $26,400 level. The first major resistance is now near the $26,780 level, above which the price might rise toward the $27,000 resistance.
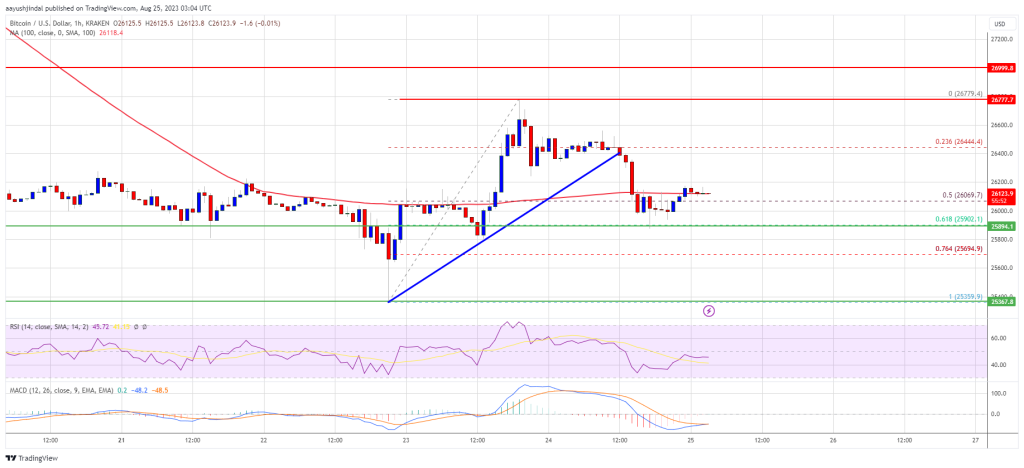
Source: BTCUSD on TradingView.com
To start a strong increase, the price must settle above the $27,000 resistance. In the stated case, the price could test the $27,800 level. Any more gains might set the pace for a larger increase toward $28,200.
More Losses In BTC?
If Bitcoin fails to clear the $26,400 resistance, it could continue to move down. Immediate support on the downside is near the $25,900 zone.
The next major support is near the $25,400 level. A downside break below the $25,400 level might push the price again into a bearish zone. In the stated case, the price could drop toward $24,800.
Technical indicators:
Hourly MACD – The MACD is now losing pace in the bearish zone.
Hourly RSI (Relative Strength Index) – The RSI for BTC/USD is now below the 50 level.
Major Support Levels – $25,900, followed by $25,400.
Major Resistance Levels – $26,400, $26,780, and $27,000.
- SEO Powered Content & PR Distribution. Get Amplified Today.
- PlatoData.Network Vertical Generative Ai. Empower Yourself. Access Here.
- PlatoAiStream. Web3 Intelligence. Knowledge Amplified. Access Here.
- PlatoESG. Automotive / EVs, Carbon, CleanTech, Energy, Environment, Solar, Waste Management. Access Here.
- PlatoHealth. Biotech and Clinical Trials Intelligence. Access Here.
- ChartPrime. Elevate your Trading Game with ChartPrime. Access Here.
- BlockOffsets. Modernizing Environmental Offset Ownership. Access Here.
- Source: https://www.newsbtc.com/analysis/btc/bitcoin-price-range-26000/
- :is
- 000
- 1
- 100
- 200
- 250
- 50
- 500
- a
- above
- active
- again
- and
- any
- average
- bearish
- Bears
- before
- below
- Big
- Bitcoin
- Bitcoin Price
- Break
- BTC
- BTC/USD
- Bullish
- but
- by
- case
- Chart
- clear
- Close
- Connecting
- consolidating
- continue
- could
- data
- decent
- Decline
- down
- downside
- Drop
- Even
- fails
- First
- followed
- For
- formed
- fresh
- from
- Gains
- High
- HTTPS
- if
- immediate
- in
- Increase
- index
- Indicators
- into
- IT
- Kraken
- larger
- Level
- levels
- Line
- losing
- losses
- Low
- MACD
- major
- max-width
- might
- more
- move
- moving
- moving average
- must
- Near
- NewsBTC
- next
- now
- of
- on
- Pace
- pair
- plato
- Plato Data Intelligence
- PlatoData
- price
- Push
- range
- recovery
- relative
- relative strength index
- Resistance
- retracement
- Rise
- rsi
- set
- settle
- Simple
- Slides
- start
- started
- stated
- strength
- strong
- Struggling
- support
- support levels
- Swing
- test
- tested
- The
- There.
- to
- toward
- trade
- Trading
- TradingView
- Trend
- Upside
- was
- Wave
- were
- which
- with
- zephyrnet