Bitcoin price started a downside correction from the $31,000 zone. BTC might decline toward $29,000 before the bulls appear again.
- Bitcoin started a downside correction below the $30,500 pivot level.
- The price is trading below $30,500 and the 100 hourly Simple moving average.
- There is a key bearish trend line forming with resistance near $30,380 on the hourly chart of the BTC/USD pair (data feed from Kraken).
- The pair could extend its decline below the $29,800 and $29,500 support levels.
Bitcoin Price Corrects Lower
Bitcoin price gained pace above the $30,000 and $30,500 levels. BTC even spiked above the $31,000 level before the bears appeared. As a result, there was a bearish reaction below the $30,500 support zone.
The price declined below the $30,250 support zone and tested the $29,800 zone. A low is formed near $29,777 and the price is now consolidating. Bitcoin is now trading below $30,500 and the 100 hourly Simple moving average.
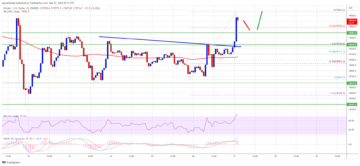
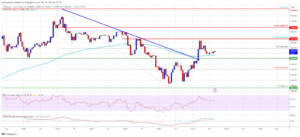
Immediate resistance is near the $30,165 level. It is near the 50% Fib retracement level of the recent decline from the $30,555 swing high to the $29,777 low. The next major resistance is near the $30,400 zone. There is also a key bearish trend line forming with resistance near $30,380 on the hourly chart of the BTC/USD pair.
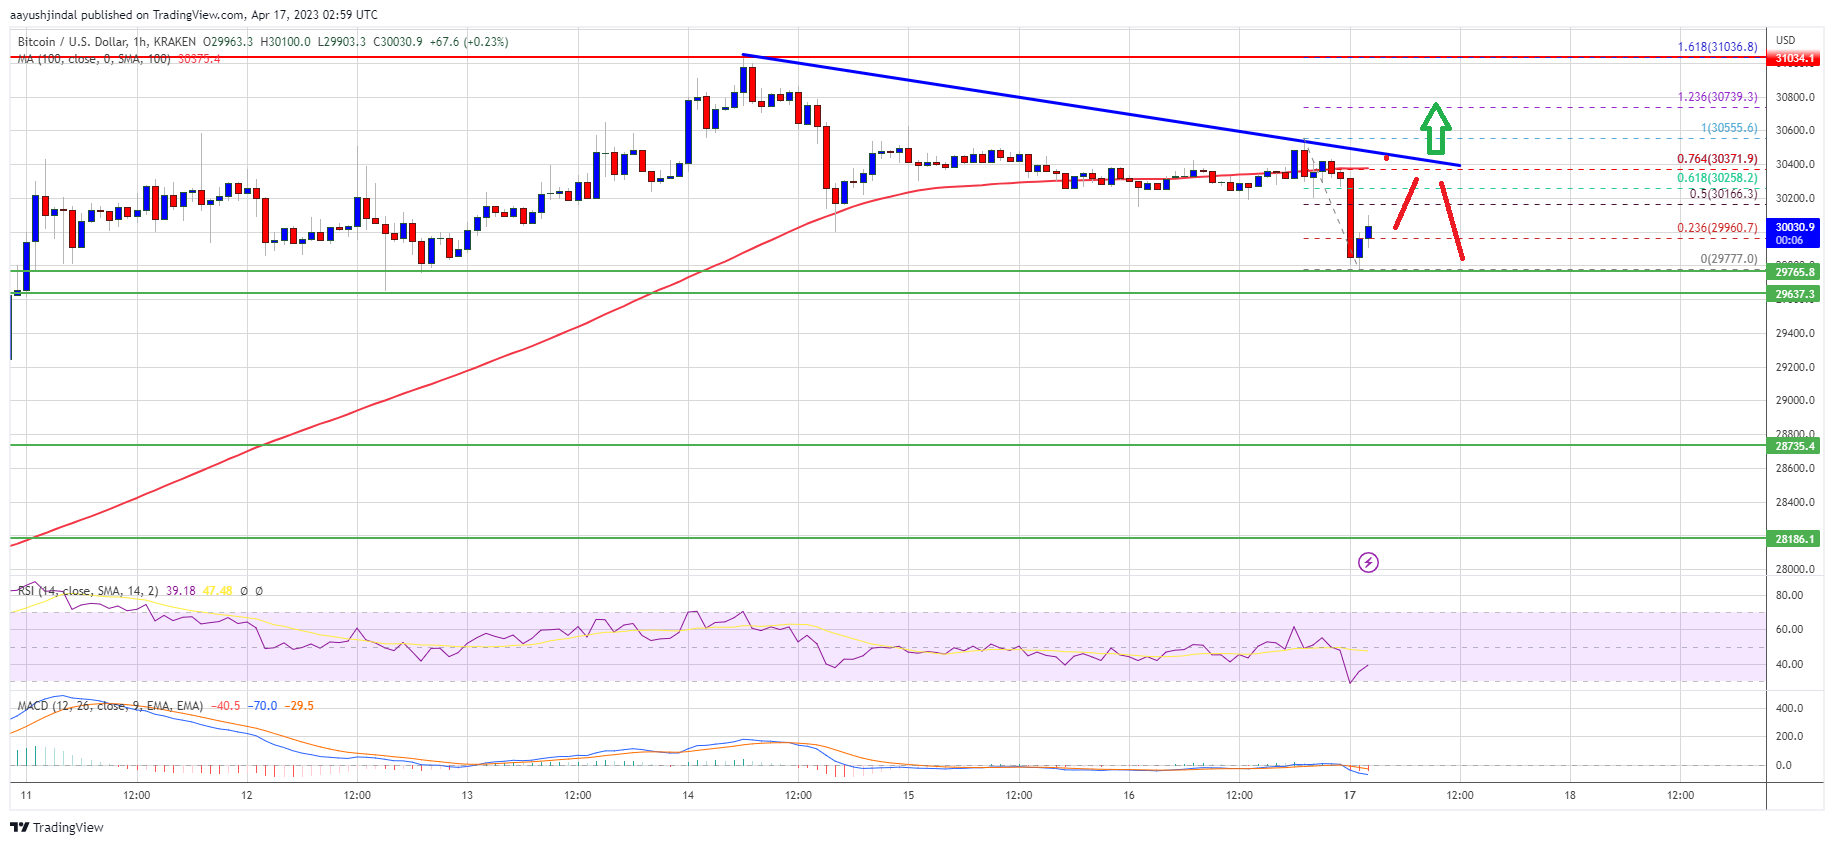
Source: BTCUSD on TradingView.com
The trend line is near the 76.4% Fib retracement level of the recent decline from the $30,555 swing high to the $29,777 low. A close above the $30,400 resistance might start another increase. In the stated case, the price may perhaps rise toward the $31,000 level. The next key resistance is near the $31,200 level, above which BTC could rise toward the $32,000 level.
More Losses in BTC?
If Bitcoin’s price fails to clear the $30,400 resistance, it could continue to move down. Immediate support on the downside is near the $30,000 level.
The next major support is near the $29,800 zone. A downside break and close below the $29,800 support might push the price toward the $29,500 support. Any more losses could lead the price toward $29,000.
Technical indicators:
Hourly MACD – The MACD is now gaining pace in the bearish zone.
Hourly RSI (Relative Strength Index) – The RSI for BTC/USD is now below the 50 level.
Major Support Levels – $30,000, followed by $29,000.
Major Resistance Levels – $30,165, $30,400, and $31,200.
- SEO Powered Content & PR Distribution. Get Amplified Today.
- Platoblockchain. Web3 Metaverse Intelligence. Knowledge Amplified. Access Here.
- Minting the Future w Adryenn Ashley. Access Here.
- Source: https://www.newsbtc.com/analysis/btc/bitcoin-price-correction-to-29k/
- :is
- 000
- 100
- a
- above
- After
- and
- Another
- appear
- appeared
- AS
- At
- average
- bearish
- Bears
- before
- below
- Bitcoin
- Bitcoin Price
- Break
- BTC
- BTC/USD
- Bulls
- by
- case
- Chart
- clear
- Close
- consolidating
- continue
- control
- could
- data
- Decline
- down
- downside
- Even
- extend
- fails
- followed
- For
- formed
- from
- gaining
- High
- horizon
- HTTPS
- immediate
- in
- Increase
- index
- Indicators
- IT
- ITS
- Key
- key resistance
- Kraken
- lead
- Level
- levels
- Line
- lose
- losses
- Low
- MACD
- major
- max-width
- May..
- might
- more
- move
- moving
- moving average
- Near
- NewsBTC
- next
- of
- on
- Pace
- perhaps
- Pivot
- plato
- Plato Data Intelligence
- PlatoData
- price
- Push
- reaction
- recent
- relative strength index
- Resistance
- result
- retracement
- Rise
- rsi
- Simple
- start
- started
- stated
- strength
- support
- support levels
- Swing
- The
- to
- toward
- Trading
- TradingView
- Trend
- which
- with
- zephyrnet