Bitcoin price attempted a fresh increase above the $34,500. BTC could start a major downside correction if there is a close below the 100 hourly SMA.
- Bitcoin is still struggling to clear the $35,000 resistance.
- The price is trading above $34,200 and the 100 hourly Simple moving average.
- There is a key rising channel forming with support near $34,300 on the hourly chart of the BTC/USD pair (data feed from Kraken).
- The pair could decline sharply if there is a close below $34,000 and then $33,400.
Bitcoin Price Holds Key Support
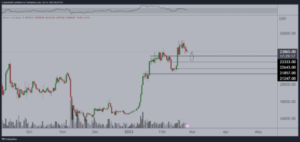
Bitcoin price started another increase above the $34,200 resistance zone. BTC climbed higher toward the $35,000 resistance zone, but there was lack of momentum.
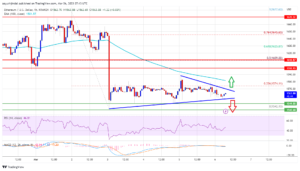
The price traded as high as $34,758 and struggled to continue higher. It is now correcting gains below the $34,500 level. There was a move below the 23.6% Fib retracement level of the upward move from the $33,318 swing low to the $34,758 high.
Bitcoin is now trading above $34,200 and the 100 hourly Simple moving average. There is also a key rising channel forming with support near $34,300 on the hourly chart of the BTC/USD pair.
On the upside, immediate resistance is near the $34,500 level. The next key resistance could be near $34,750 or the channel upper trend line. The main resistance is still near the $35,000 zone. A clear move above the $35,000 resistance might start another steady increase.

Source: BTCUSD on TradingView.com
The next key resistance could be $35,500, above which the price could test $36,200. Any more gains might send BTC toward the $36,500 level in the near term.
Downside Correction In BTC?
If Bitcoin fails to rise above the $34,750 resistance zone, it could start another decline. Immediate support on the downside is near the $34,200 level and the 100 hourly Simple moving average.
The next major support is near the $34,000 level or the 50% Fib retracement level of the upward move from the $33,318 swing low to the $34,758 high. If there is a move below $34,000, there is a risk of more downsides. In the stated case, the price could decline toward the $33,400 level or even $32,500.
Technical indicators:
Hourly MACD – The MACD is now losing pace in the bullish zone.
Hourly RSI (Relative Strength Index) – The RSI for BTC/USD is now below the 50 level.
Major Support Levels – $34,200, followed by $34,000.
Major Resistance Levels – $34,500, $34,750, and $35,000.
- SEO Powered Content & PR Distribution. Get Amplified Today.
- PlatoData.Network Vertical Generative Ai. Empower Yourself. Access Here.
- PlatoAiStream. Web3 Intelligence. Knowledge Amplified. Access Here.
- PlatoESG. Carbon, CleanTech, Energy, Environment, Solar, Waste Management. Access Here.
- PlatoHealth. Biotech and Clinical Trials Intelligence. Access Here.
- Source: https://www.newsbtc.com/analysis/btc/bitcoin-price-consolidates-35k/
- :is
- 000
- 1
- 100
- 200
- 23
- 300
- 400
- 50
- 500
- 750
- a
- above
- also
- and
- Another
- any
- AS
- attempted
- average
- BE
- bearish
- below
- Bitcoin
- Bitcoin Price
- BTC
- BTC/USD
- Bullish
- but
- by
- case
- Channel
- Chart
- clear
- Climbed
- Close
- Consolidates
- continue
- could
- data
- Decline
- downside
- downsides
- Ether (ETH)
- Even
- fails
- followed
- For
- fresh
- fresh increase
- from
- Gains
- High
- higher
- holds
- HTTPS
- if
- immediate
- in
- Increase
- index
- Indicators
- IT
- Key
- key resistance
- Kraken
- Lack
- Level
- levels
- Line
- losing
- Low
- MACD
- Main
- major
- max-width
- might
- Momentum
- more
- move
- moving
- moving average
- Near
- NewsBTC
- next
- now
- of
- on
- or
- Pace
- pair
- plato
- Plato Data Intelligence
- PlatoData
- price
- reaction
- relative
- relative strength index
- Resistance
- retracement
- Rise
- rising
- Risk
- rsi
- send
- Simple
- SMA
- start
- started
- stated
- steady
- Still
- strength
- Struggling
- support
- support levels
- Swing
- term
- test
- The
- then
- There.
- to
- toward
- traded
- Trading
- TradingView
- Trend
- trigger
- Upside
- upward
- was
- What
- which
- with
- zephyrnet