Bitcoin price remains strong on technical data and fundamentals, but breaking above the rectangle at $64,000 is key to resuming the uptrend.
Bitcoin bulls remain bullish as validated by figures from the crypto fear and greedy index. The index reveals that the fear and greedy index for the Bitcoin price is in then greed index around 74. This is validated by BTC’s price action on the daily chart as it has been consolidating between $58,715 and $64,108 since October 22 creating a demand zone for the big crypto.
Bitcoin Fear and Greed Index is 73 — Greed
Current price: $61,138 pic.twitter.com/KYB03qZrxQ— Bitcoin Fear and Greed Index (@BitcoinFear) November 4, 2021
This sluggish BTC price action over the last fortnight will need support from the wider market to determine the direction the Bitcoin price will take in the short term.
At the moment, the BTC/USD price appears to consolidating above $62,000 after recording less than 1% gains over the last 24 hours.
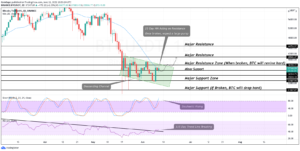
Bitcoin Price Forms a Rectangle Pattern in a Horizontal Price Action
Since October 22, Bitcoin has been trading sideways between the $58,715 and $64,108 price range. This points to price consolidation and a decrease in price volatility. This is validated by the squeezing of the Bollinger Bands (BB) towards each other.
After bouncing off the $47,000 psychological level on October 04, bulls regained control of the BTC market pushing the big crypto a massive 43% rally to hit the current all-time high (ATH) around $67,000.
At the time of writing Bitcoin teeters around $62,058 on most exchanges and appears to have formed a rectangle pattern on the daily chart. Note that the rectangle pattern does not have a defined bullish or bearish breakout, but breaking above the upper boundary of the rectangle around $64,108 will trigger a bullish move for BTC.
Bitcoin seems to be battling immediate resistance around the $62,631 level coinciding with the middle boundary of the rising channel. For a bullish move to be confirmed, BTC price must close the session above this level to tag the upper boundary of the rectangle at $64,108.
A decisive bullish break out will be confirmed if BTC slices through this level after which a retest of the all-time high around $67,000 will be in the offing. This coincides with the upper tip of the ascending channel.
BTC/USD Daily Chart
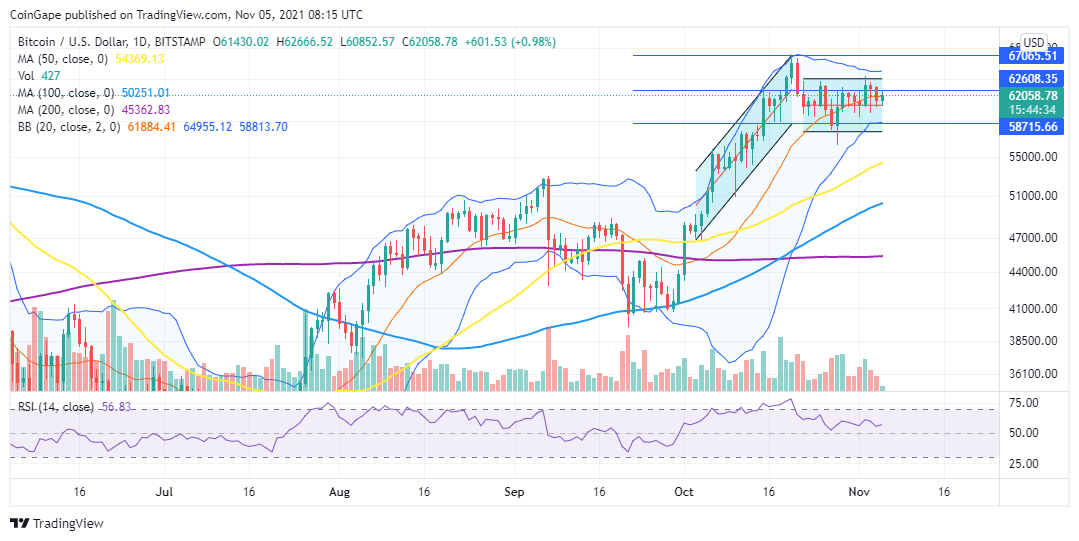
On the flipside, if BTC closes the day below the immediate support provided by the middle boundary of the rectangle at $60,950, the $58,715 support where the lower boundaries of the rising channel and the BB coincide.
- 000
- Action
- All
- analysis
- around
- bearish
- Bitcoin
- Bitcoin Price
- Bitcoin Price Analysis
- breakout
- BTC
- btc price
- BTC/USD
- Bullish
- Bulls
- consolidation
- content
- Creating
- crypto
- cryptocurrencies
- Current
- data
- day
- Demand
- financial
- Fundamentals
- High
- hold
- HTTPS
- index
- investing
- IT
- Key
- Level
- Market
- market research
- move
- Opinion
- Other
- Pattern
- price
- Price Analysis
- rally
- range
- research
- Share
- Short
- support
- Technical
- time
- Trading
- Volatility
- writing