On-chain data shows the Bitcoin Network Value To Transactions (NVT) ratio has formed a bearish crossover, a sign that a decline may be imminent.
Bitcoin NVT Ratio Has Formed A Historical Bearish Crossover
The “NVT ratio” is an indicator that measures the ratio between the Bitcoin market cap and transaction volume. In simple terms, what this metric tells us is whether the asset’s price (the market cap) is fairly valued compared to the network’s ability to transact coins (the transaction volume).
When the ratio has a value above 1, it means that the price may be overinflated right now, as the blockchain isn’t observing the shift of any significant amount of capital. The risk of a correction taking place generally goes up the higher the metric trends above this mark.
On the other hand, the indicator being below the threshold can imply that the market cap may be undervalued currently, and thus, a price surge may be due for the asset.
In the context of the current discussion, the NVT ratio itself isn’t of interest, but rather a modified form called the “NVT golden cross” is. This metric compares the short-term moving average (MA) of the NVT ratio (10-day) to its long-term MA (30-day).
As pointed out by an analyst in a CryptoQuant post, this NVT golden cross may be forming a pattern currently that could lead to a correction in the asset’s price.
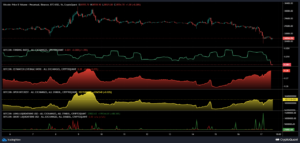
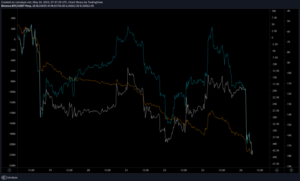
The below chart shows the trend in the Bitcoin NVT golden cross and the 30-day exponential moving average (EMA) of the same over the past year:
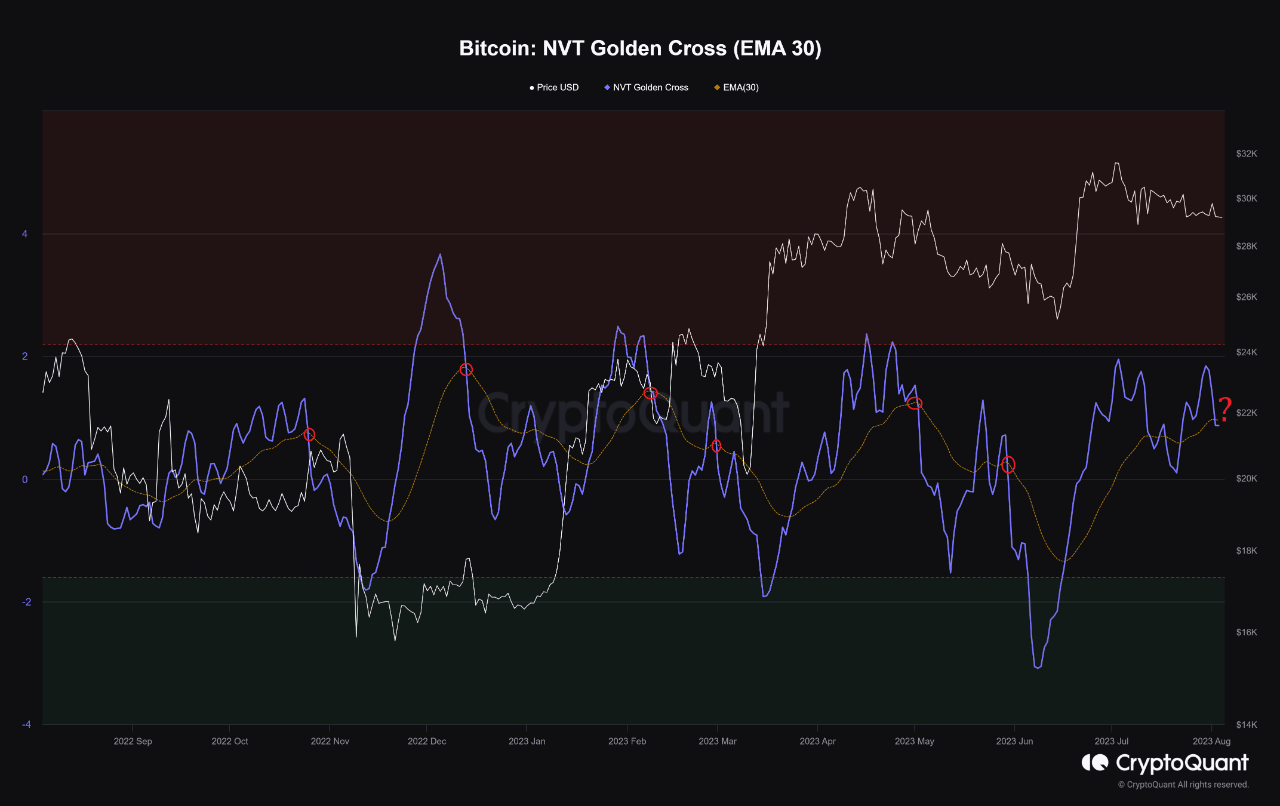
The two metrics seem to have crossed each other in recent days | Source: CryptoQuant
As displayed in the above graph, the Bitcoin NVT golden cross has been going down recently and has just crossed under its 30-day EMA. This line appears to have historically been significant for the asset, as the instances marked by the analyst shows.
Generally, whenever the indicator has crossed below this EMA line, the cryptocurrency’s value has taken a hit. From the chart, it’s visible that this pattern has already held up a few times during this rally so far.
Naturally, if this historical precedence is anything to go by, then the current bearish crossover might also lead to Bitcoin registering a drawdown in the near future.
It should be noted, though, that the crossover may not be fully confirmed yet, as the NVT golden cross has only slightly gone below the 30-day EMA so far. So it’s possible that the indicator could turn itself around in the coming days and cancel out the cross.
It now remains to be seen, whether the Bitcoin NVT golden cross and the 30-day EMA would keep going in the same trajectories and solidify the cross, or if the pattern would retrace.
BTC Price
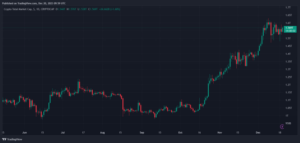
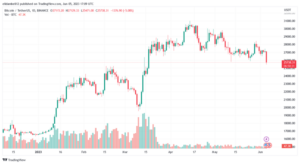
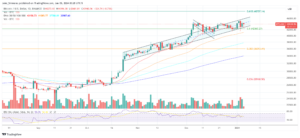
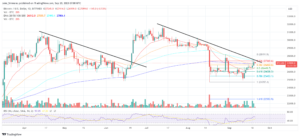
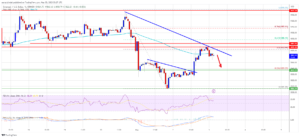
At the time of writing, Bitcoin is trading around $29,200, down 1% in the last week.
BTC has continued to show stagnation recently | Source: BTCUSD on TradingView
Featured image from mana5280 on Unsplash.com, charts from TradingView.com, CryptoQuant.com
- SEO Powered Content & PR Distribution. Get Amplified Today.
- PlatoData.Network Vertical Generative Ai. Empower Yourself. Access Here.
- PlatoAiStream. Web3 Intelligence. Knowledge Amplified. Access Here.
- PlatoESG. Automotive / EVs, Carbon, CleanTech, Energy, Environment, Solar, Waste Management. Access Here.
- BlockOffsets. Modernizing Environmental Offset Ownership. Access Here.
- Source: https://www.newsbtc.com/bitcoin-news/bitcoin-nvt-shows-bearish-crossover-price-drop-incoming/
- :has
- :is
- :not
- $UP
- 1
- 200
- a
- ability
- above
- already
- also
- amount
- an
- analyst
- and
- any
- anything
- around
- AS
- asset
- average
- BE
- bearish
- been
- being
- below
- between
- Bitcoin
- Bitcoin market
- bitcoin market cap
- Bitcoin Network
- Bitcoin Price
- blockchain
- but
- by
- called
- CAN
- cap
- capital
- Chart
- Charts
- Coins
- COM
- coming
- compared
- CONFIRMED
- context
- continued
- could
- Cross
- Crossed
- cryptoquant
- Current
- Currently
- data
- Days
- Decline
- discussion
- displayed
- down
- Drop
- due
- during
- each
- EMA
- exponential
- exponential moving average
- fairly
- far
- few
- For
- form
- formed
- from
- fully
- future
- generally
- Go
- Goes
- going
- Golden
- golden cross
- gone
- graph
- hand
- Have
- Held
- higher
- historical
- historically
- Hit
- HTTPS
- if
- image
- in
- Incoming
- Indicator
- interest
- IT
- ITS
- itself
- just
- Keep
- Last
- lead
- Line
- long-term
- mark
- marked
- Market
- Market Cap
- May..
- means
- measures
- metric
- Metrics
- might
- modified
- moving
- moving average
- Near
- network
- NewsBTC
- noted
- now
- NVT
- of
- on
- only
- or
- Other
- out
- over
- past
- Pattern
- Place
- plato
- Plato Data Intelligence
- PlatoData
- possible
- price
- price chart
- price surge
- rather
- ratio
- recent
- recently
- registering
- remains
- right
- Risk
- same
- seem
- seen
- shift
- short-term
- should
- show
- Shows
- sign
- significant
- Simple
- So
- so Far
- Source
- STAGNATION
- surge
- taken
- taking
- tells
- terms
- that
- The
- then
- this
- though?
- threshold
- Thus
- time
- times
- to
- Trading
- TradingView
- transact
- transaction
- Transactions
- Trend
- Trends
- TURN
- two
- under
- Unsplash
- us
- value
- valued
- visible
- volume
- week
- What
- whenever
- whether
- would
- writing
- year
- yet
- zephyrnet