The largest cryptocurrency by market capitalization, Bitcoin, saw a price rally of over 10% after a false rumour making waves in the cryptocurrency market suggesting the approval of the Bitcoin spot ETF (Exchange-traded Fund), as this has attracted great hopes and optimism.
There is no fire without smoke; the false news suggests it’s only a matter of time before the Bitcoin ETF is announced, as many investors, traders, and retailers believe this would be the beginning of something bigger for the crypto market.
There has been so much positive news in the cryptocurrency market lately, with promising news from the United States Security Exchange Commission (US SEC) stating it would drop all charges against Ripple (XRP).
Statistics and on-chain data for the past few days have been nothing short of encouraging for the cryptocurrency market, as the market could be on the brink of a massive bull run as it nears its impending Bitcoin halving in 2024.
- Advertisement -
The cryptocurrency heat map suggests the crypto market as a whole is looking optimistic, with many weekly top 5 cryptos (SOL, XRP, INJ, TRB, LINK) looking promising ahead of the new week as the market could look to rally higher.
Bitcoin price rallying higher from its range price moment in previous weeks suggests the market could be in for a rally, except if the present price rally for Bitcoin is just a bubble or fake out like in previous weeks.
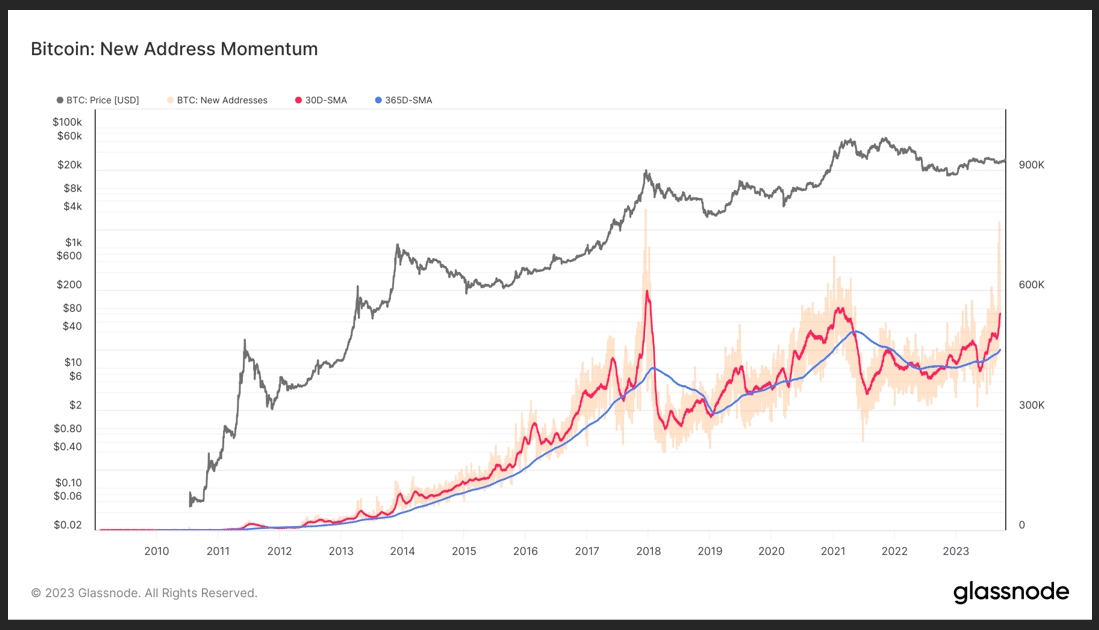
The price of Bitcoin rallying in the past few days has been accompanied by much price volume, as the data from Glassnode suggests the price of Bitcoin has experienced an increase in on-chain activities, as the data above proves true.
Bitcoin’s price rally in the past few days has highlighted many bullish scenarios for Bitcoin (BTC) bulls. This price action led to many liquidations for traders and investors, opening a short position for Bitcoin.
Aside from the fake news of Bitcoin spot ETF being approved as BTC moved with so much price action, the impending Bitcoin halving remains a big talking point for the present crypto bear market as investors, retailers, and traders would pay attention to BTC halving events.
The price of Bitcoin (BTC) formed a strong support above the region of $26,500 for months and has shown some excellent price action from this region, rallying to a high of $29,500 before touching $30,000 briefly after the rumour came out of Bitcoin spot ETF approval.
Bitcoin spot ETF approval has been a major focus for traders and investors as this would be a huge boost for BTC price to rally to a high of $45,000 or more if the news comes out in favour of Bitcoin spot ETF.
The price of Bitcoin currently looks good on higher timeframes, such as the daily, weekly, and monthly timeframes. With much price volume following the current BTC price movement, the market could be in for a ride in the coming days or weeks if the price of Bitcoin breaks above $35,000.
Bitcoin faces resistance at $31,000, its yearly all-time high for 2023. After the price of Bitcoin dropped from an all-time high of $69,500 to a low of $15,500, there was much agitation about the price dropping lower to $10,000.
The price of BTC bounced strongly, rallying to a high of $31,000 before facing rejection by bears as the price has since struggled to reclaim this region of price early this year. The price of BTC must break above $31,000 convincingly for the price to trade higher.
If the price of BTC breaks and closes above $31,500 to $32,000, we could see the price rally to $40,000 in no time as the market will be in the euphoria of price rallying higher as buyers and bulls will step in.
If Bitcoin fails to reclaim above $31,500 to $32,000, we could see the price retest the low of $27,000 as bulls have failed to overpower bears.
Bitcoin’s 50-day and 200-day Exponential Moving Averages (50-day and 200-day EMA) all indicate BTC’s bullish price action as the price of BTC currently trades above $29,500 above its 50-day and 200-day EMA, acting as support as $27,500 remains the next support region for BTC.
The key region to watch for BTC remains $31,500 to $32,000, as a break above this region could spark a new price rally to a new yearly high in the current bear market ahead of its halving.
Despite Bitcoin’s promising price rally, Ethereum remains a huge concern as the price hasn’t replicated much price momentum compared to Bitcoin and other weekly top 5 cryptos (SOL, XRP, INJ, TRB, LINK).
The price of Ethereum (ETH) has remained in a range as the price struggles below its resistance of $1,645 and $1,750, acting as a key region of resistance for Ethereum price.
Ethereum’s price trading below its daily 50-day and 200-day EMA is a cause for worry for many traders and investors considering Bitcoin acting as the catch in time past to ETH. Still, as it stands, Ethereum hasn’t lived up to expectations.
Although there hasn’t been much price action from Ethereum, let’s shift much attention to some weekly top 5 cryptos (SOL, XRP, INJ, TRB, LINK) that have remained top performers in the market for the past few days.
Solana (SOL) Price Analysis as a Weekly Top 5 Cryptos to Watch
The price of Solana (SOL) has been a big performer after BTC rallied over 25% despite fears of FTX assets being sold as the price action and volume for SOL/USDT suggest the price could be looking at flipping its resistance of $32 into support.
Solana (SOL) has remained one of the best-performing cryptocurrency assets in the crypto space despite facing tough times in the crypto bear market, with top investors such as FTX bankruptcy putting the future of Solana in despair.
The US bankruptcy court last month granted FTX permission to liquidate its massive crypto assets, creating FUD (Fear, uncertainty and doubt) as many investors and traders began shorting SOL/USDT with speculations that its price could go to $5.
Solana’s price has demonstrated great resilience in the harsh times of the crypto bear market, suggesting the price could trend higher when the market rebounds further.
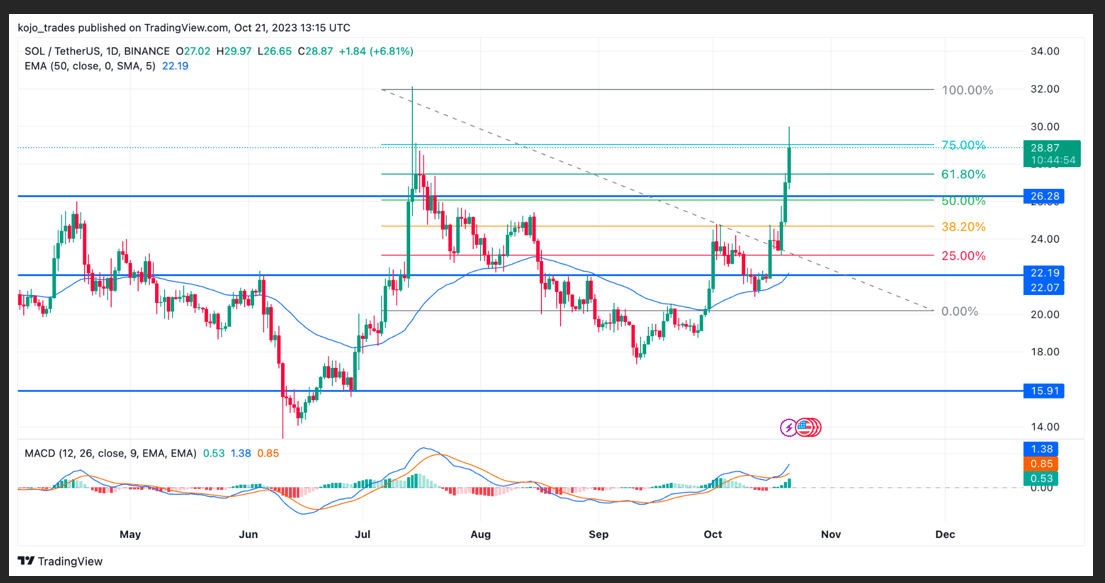
Solana’s price action has outperformed ETH recently as the price of SOL/USDT closed above its support of $23, sparking a more bullish price rally for bulls as SOL/USDT continued its rally to a high of $30 where the price faced resistance.
The price of SOL/USDT needs to break and close above this region of $30 to rally higher. If the price of SOL/USDT fails to break above $30, we could see a price retrace to $27.5, a healthy retracement for price acting as support.
The region of $27.5 corresponds to a 61.8% Fibonacci Retracement value (61.8% FIB Value) acting as support for price as it trades above the daily 50-day EMA to maintain a bullish price action.
Solana’s Moving Average Convergence Divergence and Relative Strength Index (RSI) shows bullish price action for SOL/USDT as traders and investors continue to increase their on-chain activities on the Solana network.
Major SOL/USDT support zone – $27.5
Major SOL/USDT resistance zone – $32
MACD trend – Bullish
Ripple (XRP) Daily Price Chart Analysis as a Top 5 Crypto
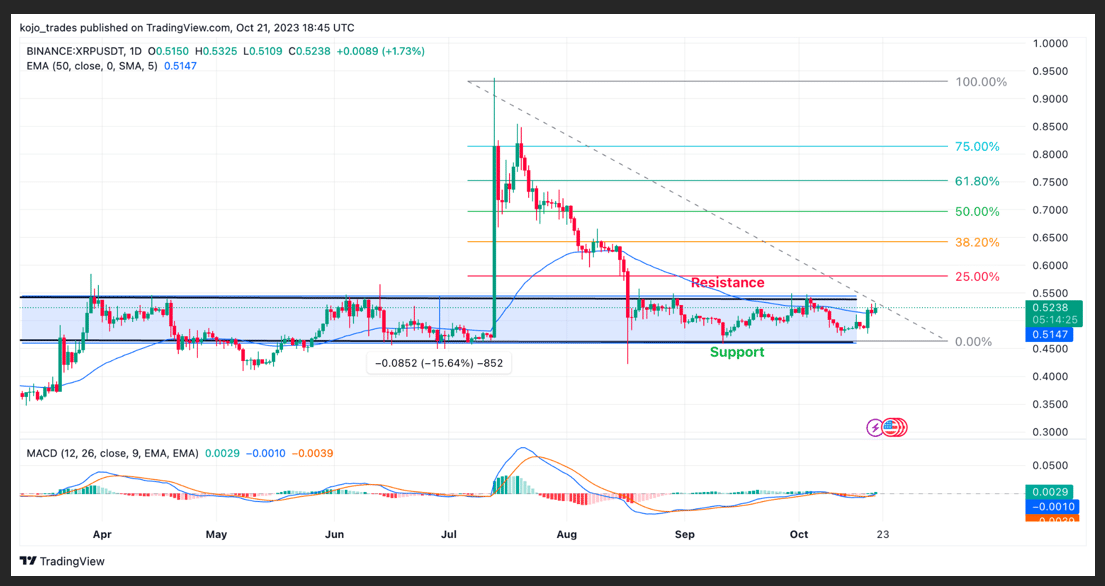
After the US SEC announced the drop of all charges against Ripple’s (XRP) top leaders, the price of XRP/USDT rallied by 6% from its crucial support of $0.46 as the price of XRP/USDT gears up for a promising week ahead.
With this news coming as a big boost for the XRP/USDT community, the price of Ripple (XRP) reclaimed its price above its daily 50-day EMA as it aims to attempt a breakout above $0.55.
The price of XRP/USDT is trying to breakout of its range above $0.55, which could spark a price rally for XRP/USDT. If the price of XRP/USDT breaks above its resistance of $0.55 with strong volume, we can see the price rally to a high of $0.66 and $0.70.
XRP/USDT needs to reclaim its price above 25% of its FIB value, acting as a key region of resistance for a more bullish scenario for XRP/USDT. If the price of XRP/USDT fails to break above its resistance, we could see the price drop to its key support of $0.46.
Ripple’s (XRP) MACD looks prime for a bullish price trend as on-chain data for XRP continues to look bullish with a rising Relative Strength Index (RSI).
Major XRP/USDT support zone – $0.46
Major XRP/USDT resistance zone – $0.55
MACD trend – Bullish
Chainlink (LINK) Daily (1D) Price Chart Analysis
Chainlink (LINK) has remained a focal point of many dApps (decentralized applications) in the cryptocurrency space, providing an easy environment to build these applications and scale them to the mainstream.
The role of Chainlink should be considered, but the price of LINK/USDT has fallen short of where it should be, comparing the growth of the LINK ecosystem, investors and activities to the price of current Chainlink.
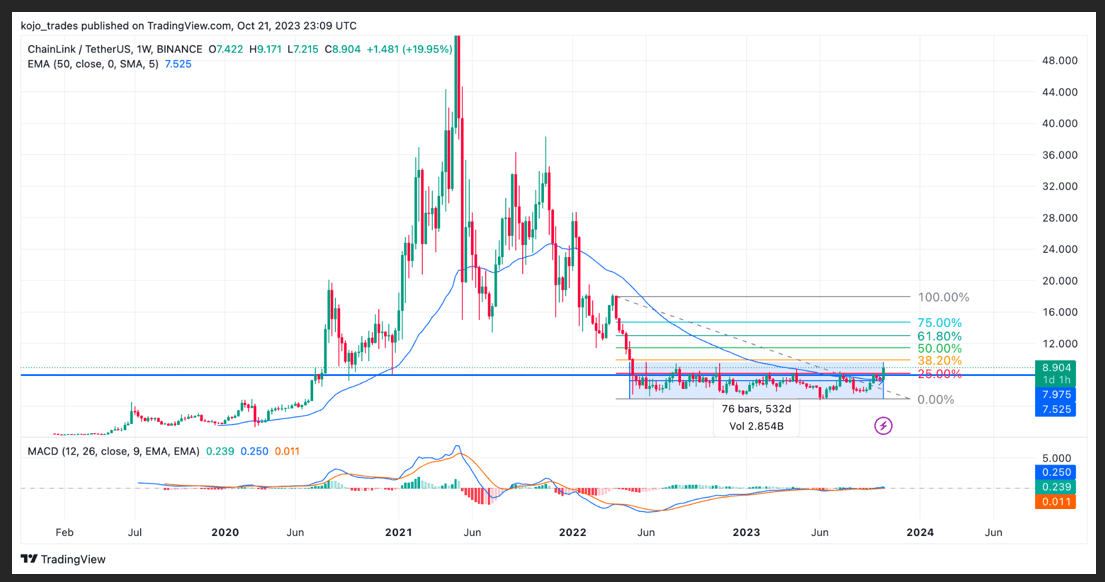
Since the price of LINK/USDT dropped from it’s all-time high of $52, the price of LINK/USDT has been trading in a range-bound movement for over 500 days now as the price attempts a breakout above $9.4.
The price action demonstrated by LINK/USDT in recent weeks has been encouraging as the price trades above its 50-day EMA and 25% FIB value, indicating the price could attempt to break above $9.4.
A break and close for LINK/USDT above $9.4 could see the price rally to a high of $12 to $15, where the price could be faced with major price resistance.
LINK/USDT MACD and RSI all point to a bullish trend in favour of bulls as the crypto market looks favourable for many crypto assets, including LINK.
Major LINK/USDT support zone – $6.6
Major LINK/USDT resistance zone – $9.4
MACD trend – Bullish
Tellor (TRB) Price Chart Analysis as a Top 5 Crypto to Watch
Tellor (TRB), a decentralized oracle protocol and an alternative to Chainlink, remains one of the top performers in 2023 as it continues to look strong on higher timeframes with no sign of slowing down anytime soon.
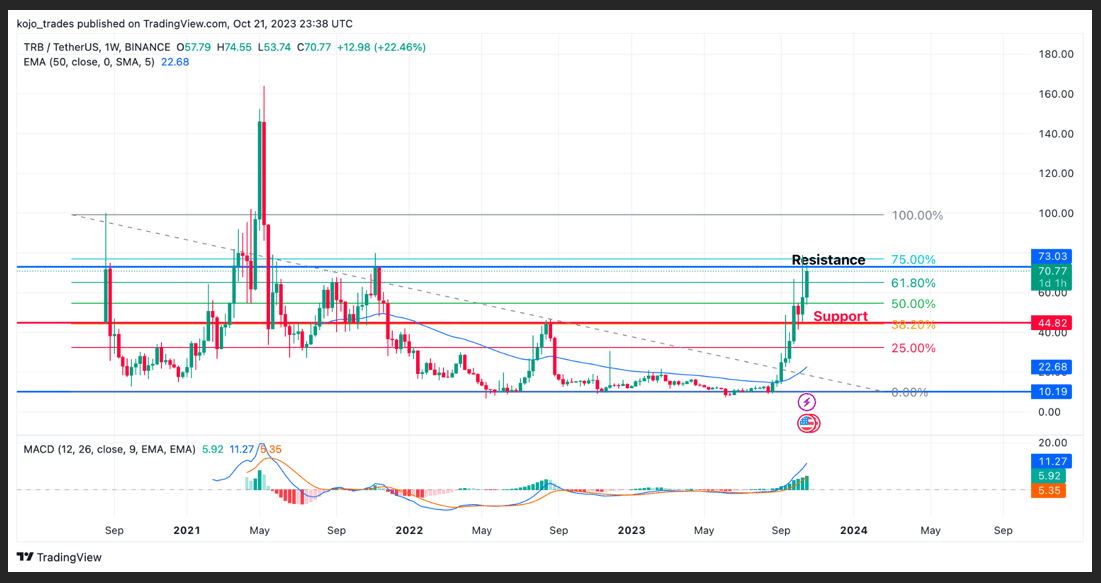
TRB/USDT has seen its price rally by over 600% in the past few months from a region of $9 to a high of $70, with so much volume suggesting a bullish price movement for this crypto token as bears struggle to hold off bullish price movement.
The price of TRB/USDT looks topped out even on the higher timeframe as the price struggled to trend above $75.
Higher timeframes, such as daily and weekly timeframes, will confirm if the price of TRB/USDT has topped; else, we could see a price rally to $100 as volume, MACD, and RSI still look bullish for TRB/USDT.
TRB/USDT faces resistance corresponding to a 75% FIB value of around $75. If the price gets rejected, we could see the price drop to a region of $44, just above the 50-day EMA and the 38.2% FIB value for a healthy retracement.
Major TRB/USDT support zone – $44
Major TRB/USDT resistance zone – $75
MACD trend – Bullish
Injective Protocol (INJ) Price Analysis on the Daily Price Chart
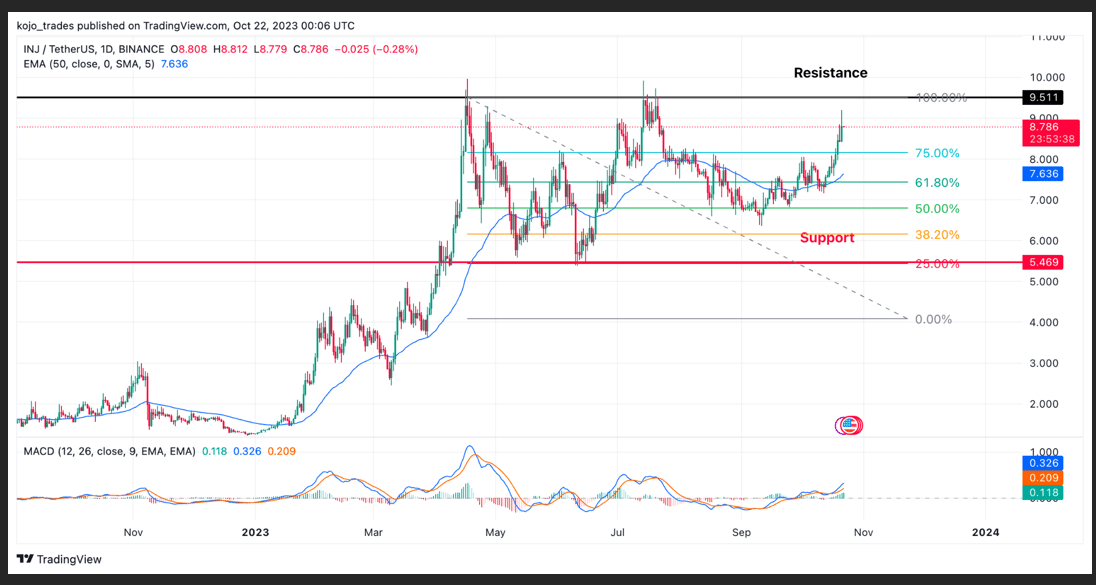
Injective protocol (INJ) remains a top performer for 2023, suggesting the price of INJ/USDT would perform beyond imagination for many traders and investors as the price has had over 900% growth this year, rallying from a low of $1.4.
The fundamentals surrounding INJ continue to call for a need to do due diligence for one of the undervalued crypto assets, as its price action in the present bear market has been outstanding.
Many traders and investors would be looking to buy INJ at a bargain, but a question remains whether the INJ/USDT price would allow traders and investors to buy cheaply as the price continues to show strength.
The price of INJ/USDT has formed strong support at $6.6 as the price continues to respect this region, trading higher above its 50-day EMA as the price faces key resistance of $9.5. In the previous price rally, the region of $9.5 remained a tough resistance for the price.
If the price of INJ/USDT fails to break above $9.5, we could see a retest of $6.6 acting as a good support, corresponding to 50% FIB value as MACD and RSI for INJ/USDT remain bullish.
Major INJ/USDT support zone – $6.6
Major INJ/USDT resistance zone – $9.5
MACD trend – Bullish
Follow Us on Twitter and Facebook.
Disclaimer: This content is informational and should not be considered financial advice. The views expressed in this article may include the author's personal opinions and do not reflect The Crypto Basic’s opinion. Readers are encouraged to do thorough research before making any investment decisions. The Crypto Basic is not responsible for any financial losses.
-Advertisement-
- SEO Powered Content & PR Distribution. Get Amplified Today.
- PlatoData.Network Vertical Generative Ai. Empower Yourself. Access Here.
- PlatoAiStream. Web3 Intelligence. Knowledge Amplified. Access Here.
- PlatoESG. Carbon, CleanTech, Energy, Environment, Solar, Waste Management. Access Here.
- PlatoHealth. Biotech and Clinical Trials Intelligence. Access Here.
- Source: https://thecryptobasic.com/2023/10/22/bitcoin-hits-29500-weekly-top-5-cryptos-to-watch-sol-xrp-inj-trb-link/?utm_source=rss&utm_medium=rss&utm_campaign=bitcoin-hits-29500-weekly-top-5-cryptos-to-watch-sol-xrp-inj-trb-link
- :has
- :is
- :not
- :where
- $UP
- 000
- 11
- 2%
- 2023
- 2024
- 29
- 46
- 500
- 66
- 70
- 750
- a
- About
- above
- accompanied
- acting
- Action
- activities
- Advertisement
- advice
- After
- against
- ahead
- aims
- All
- allow
- alternative
- an
- analysis
- and
- announced
- any
- applications
- approval
- approved
- ARE
- around
- article
- AS
- Assets
- At
- attempt
- Attempts
- attention
- attracted
- author
- average
- Bankruptcy
- Bankruptcy Court
- basic
- BE
- Bear
- Bear Market
- Bears
- been
- before
- began
- Beginning
- being
- believe
- below
- Beyond
- BEYOND IMAGINATION
- Big
- bigger
- Bitcoin
- Bitcoin ETF
- Bitcoin halving
- Bitcoin spot etf
- boost
- Break
- breakout
- breaks
- briefly
- brink
- BTC
- BTC Halving
- btc price
- bubble
- build
- bull
- Bull Run
- Bullish
- Bulls
- but
- buy
- buyers
- by
- call
- came
- CAN
- capitalization
- Catch
- Cause
- chain
- Chainlink
- charges
- Chart
- Close
- closed
- Closes
- comes
- coming
- commission
- community
- compared
- comparing
- Concern
- Confirm
- considered
- considering
- content
- continue
- continued
- continues
- Convergence
- Corresponding
- corresponds
- could
- Court
- Creating
- crucial
- crypto
- Crypto bear market
- Crypto Market
- crypto space
- crypto-assets
- cryptocurrency
- Cryptocurrency Assets
- cryptocurrency market
- cryptos
- Current
- Currently
- daily
- DApps
- data
- Days
- decentralized
- Decentralized Applications
- decisions
- demonstrated
- Despite
- diligence
- Divergence
- do
- doubt
- down
- Drop
- dropped
- Dropping
- due
- Early
- easy
- ecosystem
- else
- EMA
- encouraged
- encouraging
- Environment
- ETF
- ETH
- Ether (ETH)
- ethereum
- ethereum (ETH)
- Ethereum Price
- ethereum remains
- Even
- events
- excellent
- Except
- exchange
- Exchange Commission
- exchange-traded
- expectations
- experienced
- exponential
- expressed
- faced
- faces
- facing
- Failed
- fails
- fake
- fake news
- Fallen
- false
- fear
- fears
- few
- Fibonacci
- financial
- financial advice
- Fire
- focal
- Focus
- following
- For
- formed
- from
- FTX
- FTX Bankruptcy
- FUD
- fund
- Fundamentals
- further
- future
- gears
- gears up
- Glassnode
- Go
- good
- granted
- great
- Growth
- had
- Halving
- Have
- healthy
- High
- higher
- Highlighted
- Hits
- hold
- hopes
- http
- HTTPS
- huge
- ID
- if
- imagination
- impending
- in
- include
- Including
- Increase
- index
- indicate
- indicating
- Informational
- INJ
- into
- investment
- Investors
- IT
- ITS
- just
- Key
- key resistance
- largest
- Last
- Led
- like
- LINK
- LINK/USDT
- liquidate
- liquidations
- Look
- looking
- LOOKS
- losses
- Low
- lower
- MACD
- Mainstream
- maintain
- major
- Making
- many
- map
- Market
- Market Capitalization
- massive
- Matter
- max-width
- May..
- moment
- Momentum
- Month
- monthly
- months
- more
- moved
- movement
- moving
- moving average
- moving averages
- much
- must
- Need
- needs
- network
- New
- news
- next
- no
- nothing
- now
- of
- off
- on
- On-Chain
- on-chain data
- ONE
- only
- opening
- Opinion
- Opinions
- Optimism
- Optimistic
- or
- oracle
- Other
- out
- outperformed
- outstanding
- over
- past
- Pay
- perform
- performer
- performers
- permission
- personal
- plato
- Plato Data Intelligence
- PlatoData
- Point
- position
- positive
- present
- previous
- price
- PRICE ACTION
- Price Analysis
- price chart
- price rally
- Prime
- promising
- protocol
- proves
- providing
- Putting
- question
- rally
- rallying
- range
- readers
- recent
- recently
- reflect
- region
- Rejected..
- relative
- relative strength index
- Relative Strength Index (RSI)
- remain
- remained
- remains
- replicated
- research
- resilience
- Resistance
- respect
- responsible
- retailers
- retracement
- Ride
- Ripple
- Ripple (XRP)
- rising
- Role
- rsi
- Run
- s
- saw
- Scale
- scenario
- scenarios
- SEC
- security
- Security Exchange Commission
- see
- seen
- shift
- Short
- Shorting
- should
- show
- shown
- Shows
- sign
- since
- Slowing
- Smoke
- So
- SOL
- Solana
- Solana (SOL)
- sold
- some
- something
- Soon
- Space
- Spark
- Spot
- spot etf
- stands
- States
- stating
- Step
- Still
- strength
- strong
- strongly
- Struggle
- Struggles
- such
- suggest
- Suggests
- support
- Surrounding
- TAG
- talking
- that
- The
- The Crypto Basic
- The Future
- their
- Them
- There.
- These
- this
- this year
- time
- timeframe
- times
- to
- token
- top
- top 5
- topped
- touching
- tough
- trade
- Traders
- trades
- Trading
- Trend
- true
- trying
- Uncertainty
- United
- United States
- us
- US BANKRUPTCY
- US Sec
- USDT
- value
- views
- volume
- W3
- was
- Watch
- waves
- we
- webp
- week
- Week ahead
- weekly
- Weeks
- when
- whether
- which
- whole
- will
- with
- without
- worry
- would
- xrp
- XRP/USDT
- year
- yearly
- zephyrnet