The cryptocurrency market, including Bitcoin, Ethereum, and other altcoins, continues to face uncertainty as inflation and war threaten the financial market. There has been speculation of the market suffering a longer bearish run if such war continues to rise in other parts of the world.
Recently, the war between Russia and Ukraine has demonstrated the power of cryptocurrency as a force for good to assist many in areas affected, with the emerging rise of war in other parts of the world, like the Israel-Hamas conflict. Due to risk sentiments, there are so many uncertainties surrounding Bitcoin (BTC).
Despite much uncertainty, Bitcoin (BTC) and other cryptocurrencies remain a haven for many traders and investors as there is still much-untapped potential from the cryptocurrency market.
Another big concern for traders, investors, and institutions has been the issue of the Bitcoin ETF that is yet to be approved by the United States Security and Exchange Commission (US SEC). The SEC faces a deadline to appeal the court’s decision that rules Bitcoin’s ETF in favor of Grayscale investment.
– Advertisement –
There is high speculation of a spot Bitcoin ETF being approved next year, which could be a big boost for Bitcoin and the cryptocurrency market ahead of its halving in 2024.
The heat map from Coin360 indicates the cryptocurrency market is holding pretty well despite so many uncertainties surrounding the cryptocurrency market as Bitcoin (BTC), Ethereum (ETH), and the weekly top 5 cryptos (XRP, BNB, DOGE, LTC, ADA) continue to hold above key levels.
On-chain analysis from Coinbase suggests a trading volume of over 50% drop in trading activities for Bitcoin as the price has been trading between $26,000 to $28,000 for months.
While Bitcoin price breakout to either the upside or downside remains uncertain on higher timeframes, this has remained an area of interest for many investors and traders as they would look to open positions in the direction of the market.
The Bitcoin bulls have failed to defend the price of Bitcoin (BTC/USDT) from trading below its 50-day and 200-day Exponential Moving Averages (50-day and 200-day EMAs) as the price struggled below $27,200 acting as resistance for BTC/USDT price.
Bitcoin’s price currently trades above its 25% Fibonacci Retracement value (25% FIB value), which is a good sign for bulls as the price needs to hold above $26,500 corresponding to this 25% FIB value acting as support for BTC/USDT price.
If the price of BTC/USDT closes below $26,000, we could see Bitcoin bears stepping into the market to drive the price of Bitcoin lower to a region of $25,500 and likely towards a monthly low of $24,800 where the price has shown great strength to bounce off.
The price of Bitcoin needs to break and close above the region of $28,500, with a good volume accompanying the price rally to show the needed signs to a region of $32,000, acting as the yearly high.
Bitcoin’s trading activity volume has been low lately with its Moving Average Convergence Divergence (MACD) and its Relative Strength Index (RSI), all indicative prices moving in range for the past few months.
Unlike Bitcoin, the price of Ethereum hasn’t demonstrated the best price action in the past few weeks, as the price has remained below its 50-day and 200-day EMA, suggesting a bearish price dominance.
The price of Ethereum attempted a breakout above $1,700, but bears rejected the price as this looked like a bearish trap for those looking to open a long position for Ethereum as the price fell below $1,660, acting as a key support zone for price.
A weekly close for the price of Ethereum below its 200-day EMA could mean price retesting $1,400, acting as the next support region for bulls to salvage price from retesting its yearly low of $1,200.
If the price of Ethereum reclaims $1,750 resistance, then the price could rally high to a region of $1,900 as a minor price rally; if the price of Ethereum fails to show a promising price action in the coming days, we could see $1,400 being retested.
While most attention remains on Bitcoin and Ethereum, let’s look at the weekly top 5 cryptos (XRP, BNB, DOGE, LTC, ADA) to watch ahead of the new weeks as these cryptocurrencies possess high-profit potentials.
Ripple (XRP) Daily (1D) Price Analysis as a Top 5 Crypto to Watch
It’s not new for car brands to adopt cryptocurrencies as a mode of payment, with Tesla pioneering this in the early times. There has been big news for Ripple (XRP) as it will be used as a mode of payment for Ferrari, a notable luxurious car brand.
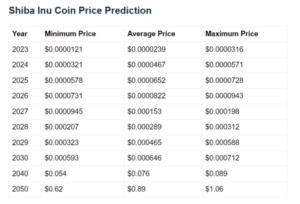
With Ferrari confirming its acceptance of Ripple and Shiba Inu as a payment mode for those in the United States, it has come as a big boost for XRP/USDT price as the price of XRP/USDT has remained in a range for the past few weeks.
Despite the price of XRP/USDT trading in a range, there have been on-chain activities suggesting it’s just a matter of time before the price of XRP/USDT breaks out of its bearish price trend that has held its price from rallying past $0.55.
On-chain data suggest the price of XRP/USDT would do extremely well as analysts speculate $3 XRP considering the level of activity and many brands adopting this weekly top 5 cryptocurrency.
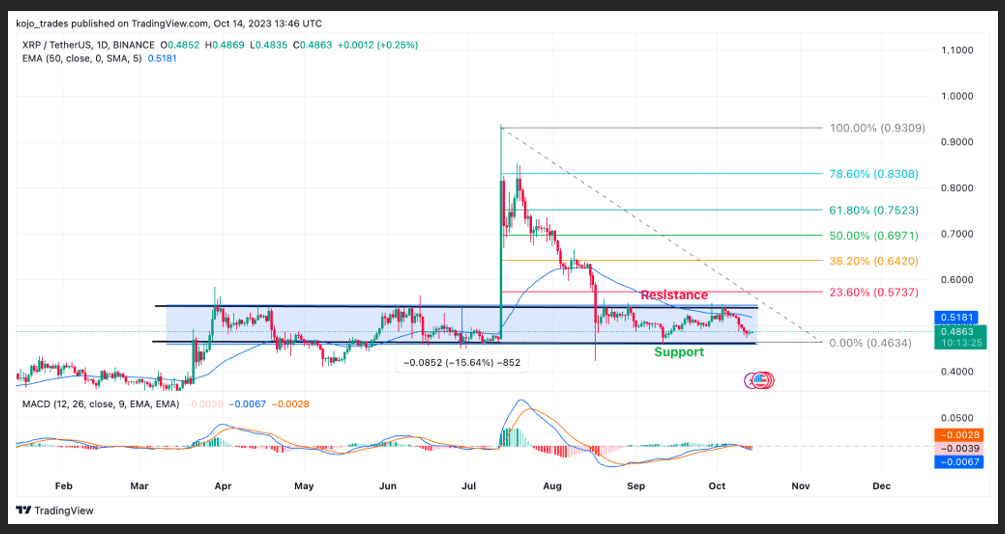
The price of XRP/USDT continues in its range-bound price movement as the price of XRP/USDT has failed to break past the region of $0.55, acting as resistance for the price despite trying to break out of its range on several attempts.
The price of XRP/USDT continues to trade below its daily 50-day EMA as its MACD indicator, and RSI indicates a bearish price trend for XRP/USDT as the price could retest the demand zone of $0.46, acting as support for bulls.
A break above $0.55 for the price of XRP/USDT could signal a bullish price rally as bulls would aim to reclaim $0.65. If the price of XRP/USDT fails to hold $0.46, support bears will push the price lower to $0.4.
Major XRP/USDT support zone – $0.46
Major XRP/USDT resistance zone – $0.55
MACD trend – Bearish
Binance Coin (BNB) Daily (1D) Price Chart Analysis
Binance Coin (BNB) has remained a top 3 coin by market capitalization as it possesses huge potential for many traders and investors considering having a huge backing from its exchange Binance and CZ.
The price of BNB/USDT has struggled in recent months with rumors stating Binance could be bankrupt, leading to the price of its native token, BNB, dropping from $400 to a region of $270 and has since struggled to find any bullish price trend on the daily timeframe.
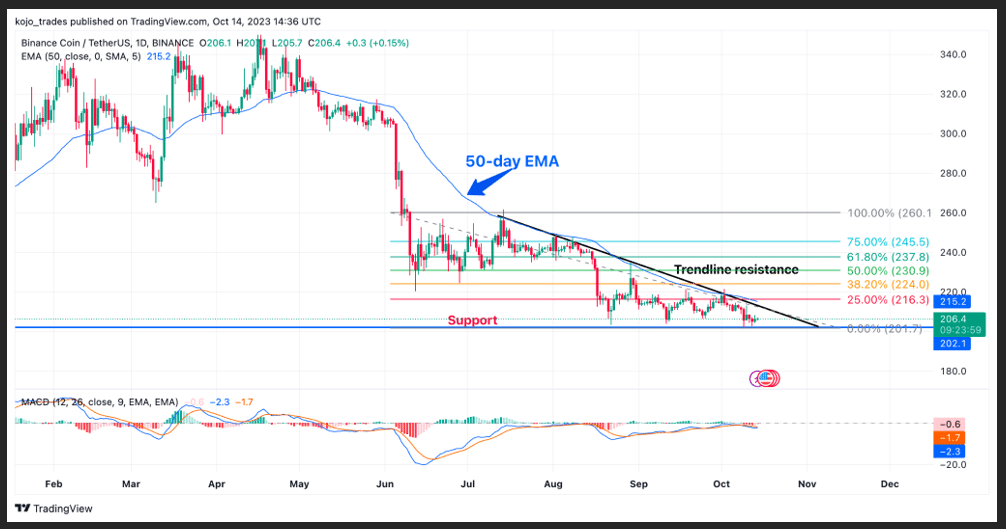
After closing below its 50-day EMA at $300, the price of BNB/USDT has remained in a bearish downtrend for months as bulls struggle to flip this trend to a bullish trend, suggesting bears dominate the price of BNB/USDT.
The price of BNB/USDT sits above the key area of interest, around $200, which is also a region of support and demand zone for bulls from past price action. If the price of BNB/USDT closes below $200, we could see bears push BNB/USDT to $180 to $150.
Binance Coin bulls need to step in to rescue the price of BNB from going lower as the price trades below 25% of its FIB value, around 0%, which is not a safe place for bulls currently.
BNB’s MACD and RSI suggest a bearish trend continuation as bulls need to step in to rescue the price of BNB/USDT from this bear dominance.
Major BNB/USDT support zone – $200
Major BNB/USDT resistance zone – $250
MACD trend – Bullish
Dogecoin (DOGE) Price Analysis as One of the Weekly Top 5 Cryptos
Dogecoin (DOGE) has endured rather turbulent times as the bears have tried to force price trade below its crucial support and demand zone of $0.055 as the price has shown strength, holding well above this region.
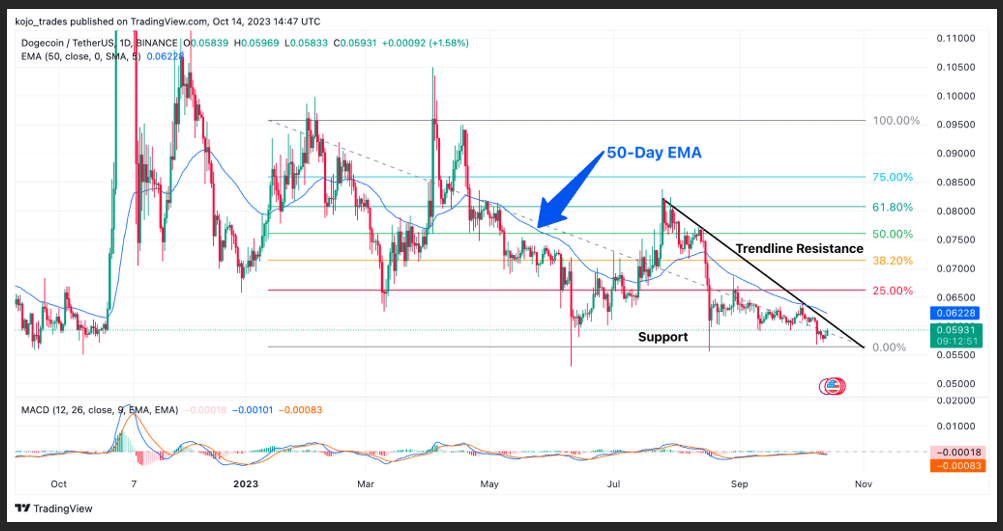
The price of DOGE/USDT has struggled to regain any glimpse of price bounce or bullish price rally after its rejection to trend higher above $0.085 as the price has traded below its daily 50-day EMA for weeks.
Dogecoin needs to reclaim the region of 25% FIB value, which corresponds to $0.066 above the 50-day EMA, for its price to resume a minor bullish price bounce as bulls would be more willing to buy into DOGE/USDT price.
If the price of DOGE/USDT fails to reclaim its price above $0.066, we could see the price remain in a downtrend. The support of $0.055 is key to bulls; if this region is lost, the price will drop to a low of $0.045.
Dogecoin MACD and RSI on the daily chart indicate that the price could make a minor bounce to a region of $0.062, just below its 50-day EMA, and if the price breaks higher, the trend could change from bearish to bullish.
Major DOGE/USDT support zone – $0.055
Major DOGE/USDT resistance zone – $0.066
MACD trend – Bullish
Litecoin (LTC) Price Analysis on the Daily (1D) Chart
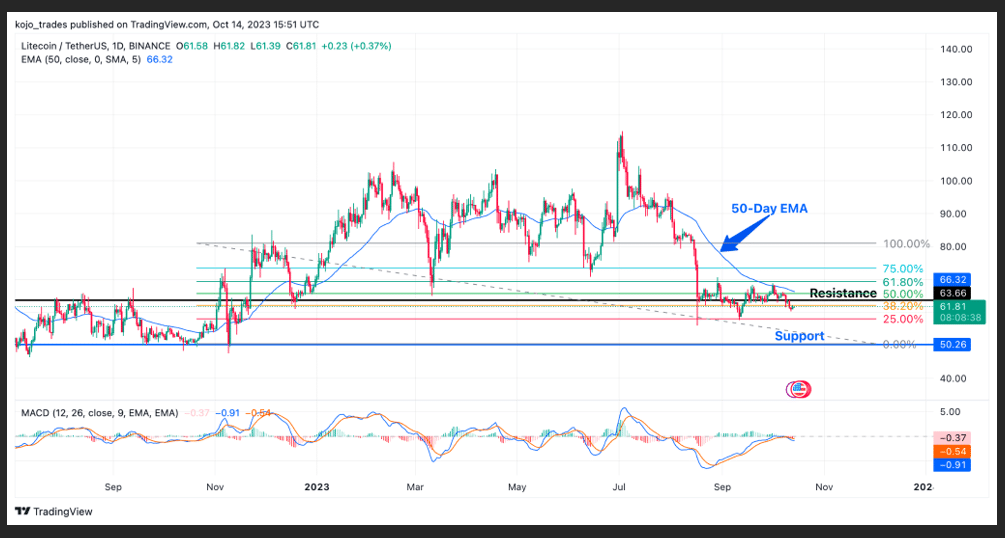
Litecoin (LTC) price continues to plunge from its high of $110 after its rally ahead of its halving as sentiment was a huge catalyst to the rally of LTC/USDT. The price has since dropped from a high of $115 as it struggles to hold above $60.
On-chain data indicates the whale activity for LTC has hit a three-year low as the price struggles to hold off bears from its price dominance. The trading volume for LTC/USDT has reduced so much compared to its trading activities ahead of its pre-halving.
After dropping below $88, the price of LTC/USDT has remained under the 50-day EMA, suggesting a bearish price trend that could continue to a low of $50 if bears sustain the current bearish trend.
LTC/USDT price needs to reclaim above 38.2% FIB value and trade above $67 for the price to have a chance of a minor bullish price bounce.
Litecoin’s MACD and RSI on the daily timeframe suggest a bearish price trend, except the price reclaims above $66 resistance to enable bulls to push the price higher to a region of $74.
If LTC/USDT bulls fail to protect $60 support, bears would be willing to lower LTC prices.
Major LTC/USDT support zone – $60
Major LTC/USDT resistance zone – $66
MACD trend – Bearish
Cardano (ADA) Price Analysis as a Top 5 Cryptos to Watch
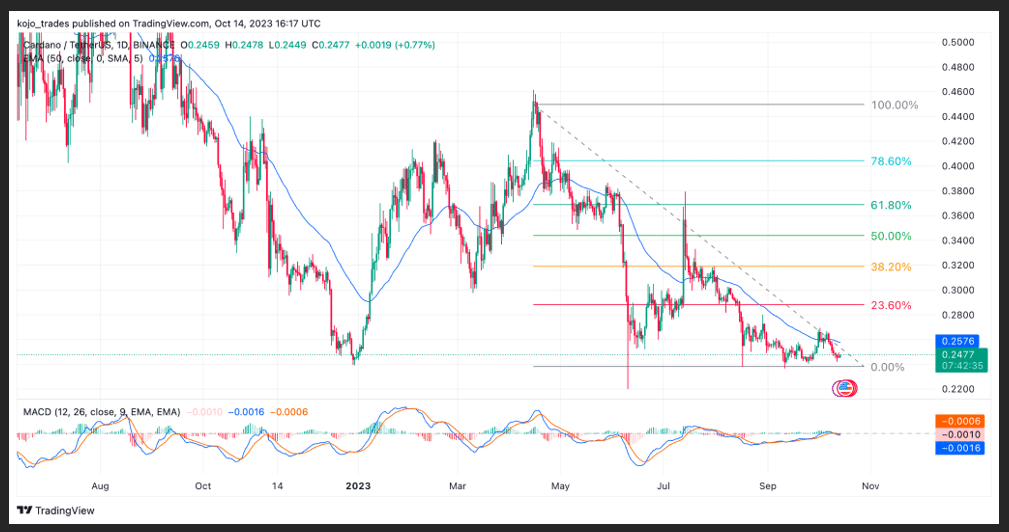
Cardano (ADA) has seen over 45% drop from its yearly high of $0.46 as many Cardano faithful wonder if it’s time to jump ship as the price of ADA/USDT does not look like it could have a reversal in trend.
The price of ADA/USDT lost its 50-day EMA at $0.3 and has struggled to break above this 50-day EMA, acting as resistance for the price of ADA/USDT.
The price of ADA/USDT needs to break and close $0.26, acting as resistance, which corresponds to the 50-day EMA for the price to show a bullish price bounce.
The price of ADA/USDT sits on key support of $0.24 as bulls need to defend this region to avoid bears pushing the price of ADA/USDT to a yearly low of $0.2 to $0.18.
Cardano’s MACD and RSI all indicate bearish price dominance as bulls need to rescue the ADA/USDT price.
Considering the price of Cardano have seen over 80% drop, many trader and investors would be wondering if this is the right time to cut losses and move on.
This could be a good price for long-term holders to buy and hold ahead of the next bull market.
Major ADA/USDT support zone – $0.24
Major ADA/USDT resistance zone – $0.26
MACD trend – Bullish
Follow Us on Twitter and Facebook.
Disclaimer: This content is informational and should not be considered financial advice. The views expressed in this article may include the author’s personal opinions and do not reflect The Crypto Basic’s opinion. Readers are encouraged to do thorough research before making any investment decisions. The Crypto Basic is not responsible for any financial losses.
-Advertisement-
- SEO Powered Content & PR Distribution. Get Amplified Today.
- PlatoData.Network Vertical Generative Ai. Empower Yourself. Access Here.
- PlatoAiStream. Web3 Intelligence. Knowledge Amplified. Access Here.
- PlatoESG. Carbon, CleanTech, Energy, Environment, Solar, Waste Management. Access Here.
- PlatoHealth. Biotech and Clinical Trials Intelligence. Access Here.
- Source: https://thecryptobasic.com/2023/10/15/bitcoin-etf-weekly-top-5-cryptos-to-watch-xrp-bnb-doge-ltc-ada/?utm_source=rss&utm_medium=rss&utm_campaign=bitcoin-etf-weekly-top-5-cryptos-to-watch-xrp-bnb-doge-ltc-ada
- :has
- :is
- :not
- :where
- $3
- 000
- 11
- 15%
- 2%
- 200
- 2024
- 23
- 24
- 26
- 400
- 46
- 500
- 65
- 700
- a
- above
- acceptance
- acting
- Action
- activities
- activity
- ADA
- adopt
- Adopting
- Advertisement
- advice
- After
- ahead
- aim
- All
- also
- Altcoins
- an
- analysis
- Analysts
- and
- any
- appeal
- approved
- ARE
- AREA
- areas
- around
- article
- AS
- assist
- At
- attempted
- Attempts
- attention
- author
- average
- avoid
- backing
- bankrupt
- basic
- BE
- Bear
- bearish
- Bears
- been
- before
- being
- below
- BEST
- between
- Big
- binance
- Bitcoin
- bitcoin and ethereum
- Bitcoin bears
- bitcoin bulls
- Bitcoin ETF
- Bitcoin Price
- bnb
- BNB/USDT
- boost
- Bounce
- brand
- brands
- Break
- break out
- breakout
- breaks
- BTC
- BTC/USDT
- bull
- Bull Market
- Bullish
- Bulls
- but
- buy
- by
- capitalization
- car
- Cardano
- Catalyst
- Chance
- change
- Chart
- Close
- Closes
- closing
- Coin
- coinbase
- come
- coming
- commission
- compared
- Concern
- conflict
- considered
- considering
- content
- continuation
- continue
- continues
- Convergence
- Corresponding
- corresponds
- could
- crucial
- crypto
- cryptocurrencies
- cryptocurrency
- cryptocurrency market
- cryptos
- Current
- Currently
- Cut
- CZ
- daily
- data
- Days
- decision
- decisions
- Demand
- demonstrated
- Despite
- direction
- Divergence
- do
- does
- Doge
- Doge price
- doge price analysis
- DOGE/USDT
- Dominance
- dominate
- downside
- drive
- Drop
- dropped
- Dropping
- due
- Early
- either
- EMA
- emerging
- enable
- encouraged
- ETF
- ETH
- Ether (ETH)
- ethereum
- ethereum (ETH)
- Except
- exchange
- Exchange Commission
- exponential
- expressed
- extremely
- Face
- faces
- FAIL
- Failed
- fails
- faithful
- favor
- Ferrari
- few
- Fibonacci
- financial
- financial advice
- Financial Market
- Find
- Flip
- For
- Force
- from
- Glimpse
- going
- good
- Grayscale
- great
- Halving
- Have
- haven
- having
- Held
- High
- higher
- Hit
- hold
- holders
- holding
- http
- HTTPS
- huge
- if
- in
- In other
- include
- Including
- index
- indicate
- indicates
- indicative
- Indicator
- inflation
- Informational
- institutions
- interest
- into
- Inu
- investment
- Investors
- issue
- IT
- ITS
- jump
- just
- Key
- key levels
- leading
- Level
- levels
- like
- likely
- Long
- long-term
- long-term holders
- longer
- Look
- look like
- looked
- looking
- losses
- lost
- Low
- lower
- LTC
- LTC/USDT
- luxurious
- MACD
- make
- Making
- many
- map
- Market
- Market Capitalization
- Matter
- max-width
- May..
- mean
- minor
- Mode
- monthly
- months
- more
- most
- move
- movement
- moving
- moving average
- moving averages
- much
- native
- Native Token
- Need
- needed
- needs
- New
- news
- next
- notable
- Oct
- of
- off
- on
- On-Chain
- ONE
- open
- Opinion
- Opinions
- or
- Other
- out
- over
- parts
- past
- payment
- personal
- Pioneering
- Place
- plato
- Plato Data Intelligence
- PlatoData
- plunge
- position
- positions
- possess
- potential
- potentials
- power
- pretty
- price
- PRICE ACTION
- Price Analysis
- price chart
- price rally
- Prices
- promising
- protect
- Push
- Pushing
- rally
- rallying
- range
- rather
- readers
- recent
- Reduced
- reflect
- regain
- region
- Rejected..
- relative
- relative strength index
- Relative Strength Index (RSI)
- remain
- remained
- remains
- rescue
- research
- Resistance
- responsible
- resume
- retracement
- Reversal
- right
- Ripple
- Rise
- Risk
- rsi
- rules
- Rumors
- Run
- Russia
- s
- safe
- SEC
- security
- see
- seen
- sentiment
- sentiments
- several
- Shiba
- Shiba Inu
- should
- show
- shown
- sign
- Signal
- Signs
- since
- sits
- So
- speculation
- Spot
- Spot Bitcoin Etf
- States
- stating
- Step
- stepping
- Still
- strength
- Struggle
- Struggles
- such
- suffering
- suggest
- Suggests
- support
- Surrounding
- Tesla
- that
- The
- The Crypto Basic
- The Weekly
- the world
- then
- There.
- These
- they
- this
- those
- threaten
- time
- timeframe
- times
- to
- token
- top
- top 5
- towards
- trade
- traded
- trader
- Traders
- trades
- Trading
- trading volume
- Trend
- tried
- trying
- turbulent
- Ukraine
- Uncertain
- uncertainties
- Uncertainty
- under
- United
- United States
- Upside
- us
- US Sec
- USD
- USDT
- used
- value
- views
- volume
- W3
- war
- was
- Watch
- we
- webp
- weekly
- Weeks
- WELL
- Whale
- which
- will
- willing
- with
- wonder
- wondering
- world
- would
- xrp
- XRP/USDT
- year
- yearly
- yet
- zephyrnet