Earn Your First Bitcoin Sign up and get $12 Bonus Referral bonus up to $3,000
- Bitcoin cash price started a fresh decline below the $120 zone against the US Dollar.
- The price is now trading below the $118 zone and the 55 simple moving average (4 hours).
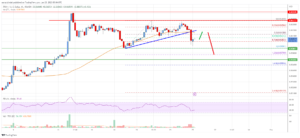
- There was a break below a key bullish trend line with support at $116.00 on the 4-hour chart of the BCH/USD pair (data feed from Coinbase).
- The pair could continue to move down if it stays below the $116 resistance zone.
Bitcoin cash price is declining below the $118 zone against the US Dollar, similar to Bitcoin. BCH/USD could extend losses if there is a close below $112.
Bitcoin Cash Price Analysis
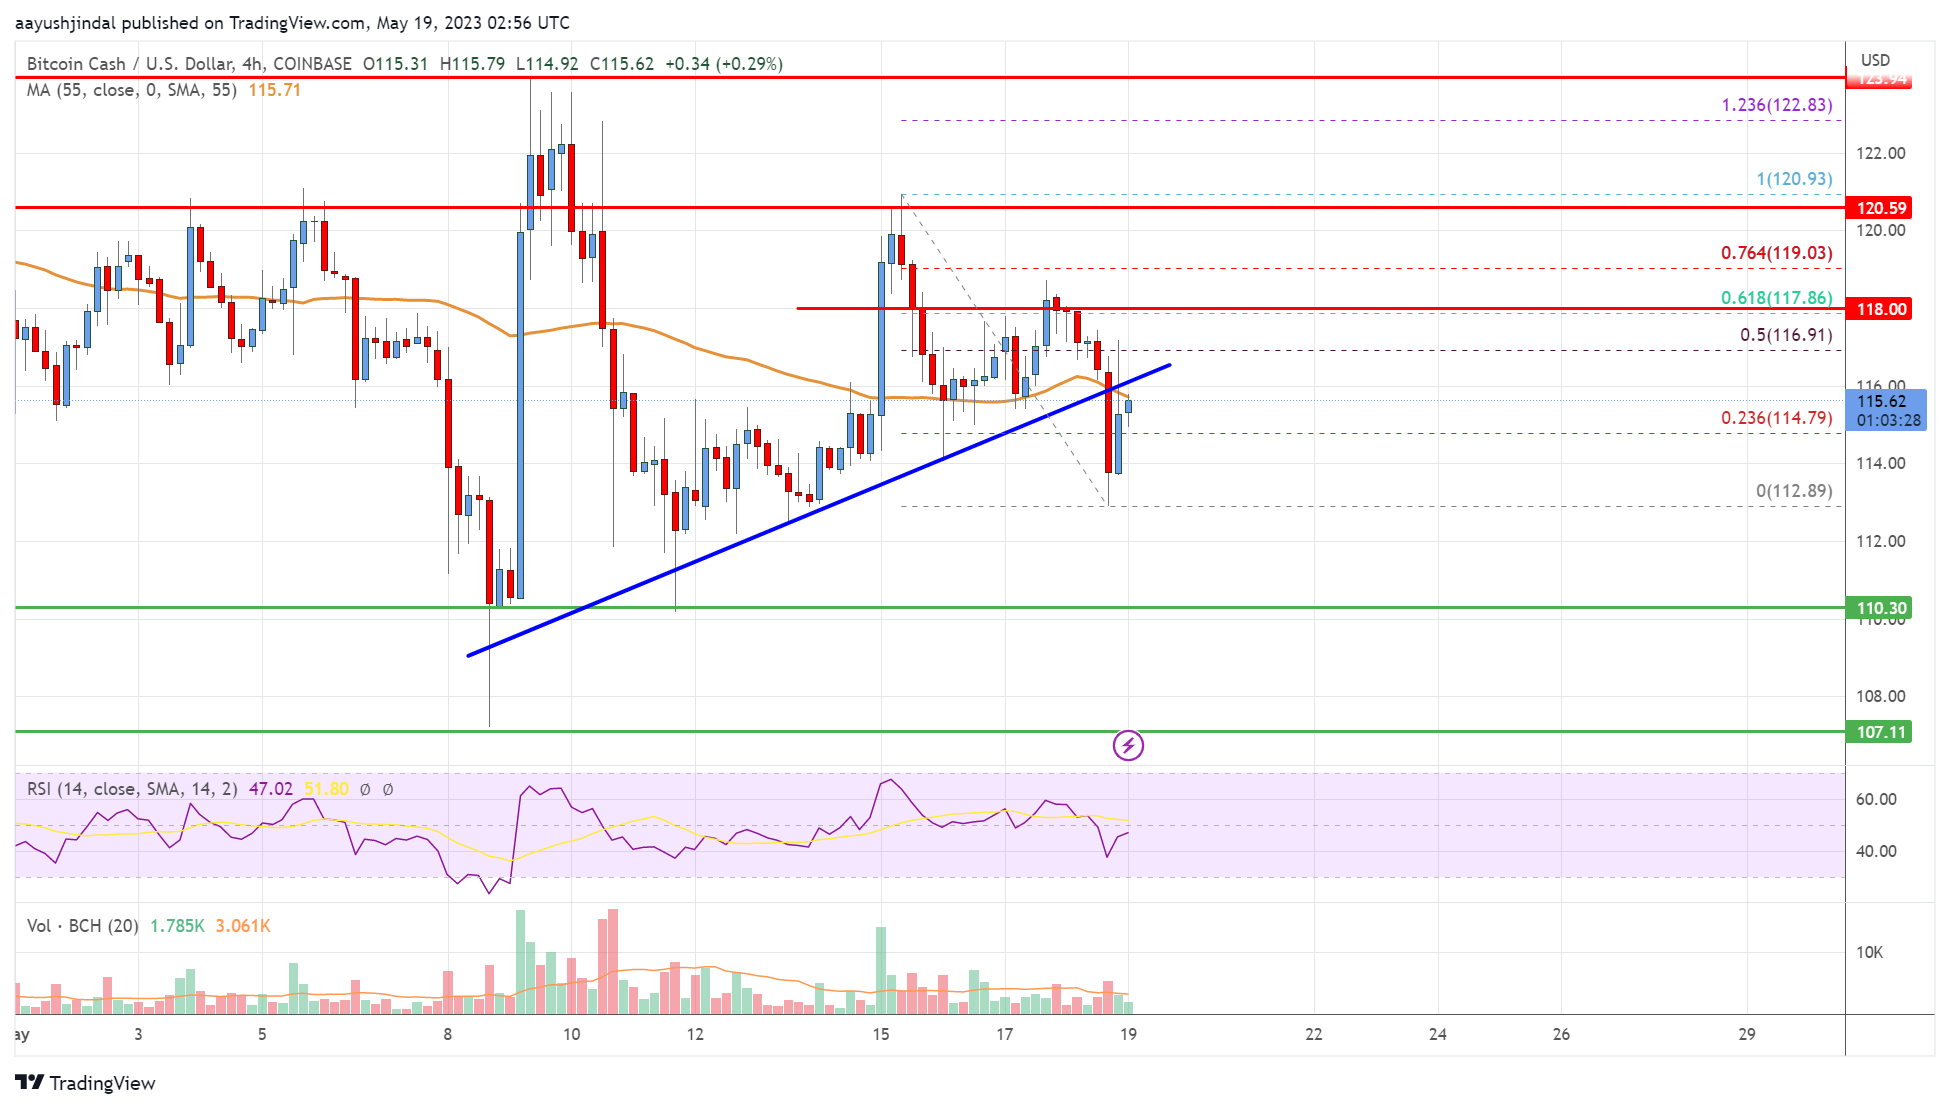
Bitcoin cash price struggled to gain pace for a move above the $120 and $122 resistance levels. BCH formed a high near $120.93 and started a fresh decline.
There was a clear move below the $118.00 and $116.00 support levels. The pair even declined below the $116 support. It tested the $112 zone. A low is formed near $112.89 and the price is now consolidating losses. It is now trading above the 23.6% Fib retracement level of the recent decline from the $120.93 swing high to the $112.89 low.
Besides, it is trading below the $118 zone and the 55 simple moving average (4 hours). Immediate resistance is near the $116.00 level and the 55 simple moving average (4 hours).
The 50% Fib retracement level of the recent decline from the $120.93 swing high to the $112.89 low is also near $116. The next key resistance is near $118. Any more gains above $116 and $118 could set the pace for a move toward the $120 level.
If there is a move above the $120 resistance, the price could rise toward the $128 zone. If not, the price might continue lower below $112. Immediate support on the downside is near the $110 zone. The next major support is near the $105 level, below which the bears might aim for $100.
Bitcoin Cash Price
Looking at the chart, Bitcoin cash price is now trading below the $118 zone and the 55 simple moving average (4 hours). Overall, the price could continue to move down if it stays below the $120 resistance zone.
Technical indicators
4 hours MACD – The MACD for BCH/USD is losing pace in the bearish zone.
4 hours RSI (Relative Strength Index) – The RSI for BCH/USD is below the 50 level.
Key Support Levels – $112 and $110.
Key Resistance Levels – $116 and $118.
- SEO Powered Content & PR Distribution. Get Amplified Today.
- PlatoAiStream. Web3 Data Intelligence. Knowledge Amplified. Access Here.
- Minting the Future w Adryenn Ashley. Access Here.
- Buy and Sell Shares in PRE-IPO Companies with PREIPO®. Access Here.
- Source: https://www.livebitcoinnews.com/bitcoin-cash-analysis-risk-of-fresh-drop-to-105/
- :is
- :not
- $3
- $UP
- 23
- 28
- 50
- 7
- a
- above
- against
- aim
- also
- analysis
- and
- any
- At
- average
- BCH
- BCH/USD
- bearish
- Bears
- below
- Bitcoin
- Bitcoin Cash
- Bitcoin News
- Bonus
- Break
- Bullish
- Cash
- Chart
- clear
- Close
- coinbase
- COM
- comments
- consolidating
- continue
- could
- data
- Decline
- Declining
- Dollar
- down
- downside
- Drop
- end
- Even
- extend
- First
- follow
- For
- formed
- fresh
- from
- Gain
- Gains
- get
- High
- HOURS
- HTTPS
- if
- immediate
- in
- index
- internal
- IT
- Key
- key resistance
- Level
- levels
- Line
- live
- Live Bitcoin News
- logo
- losing
- losses
- Low
- MACD
- major
- might
- more
- move
- moving
- moving average
- Near
- news
- next
- now
- of
- on
- overall
- Pace
- pair
- plato
- Plato Data Intelligence
- PlatoData
- Post
- price
- recent
- Referral
- relative strength index
- Resistance
- retracement
- Rise
- Risk
- rsi
- set
- sign
- similar
- Simple
- started
- strength
- support
- support levels
- Swing
- TAG
- The
- There.
- to
- toward
- Trading
- TradingView
- Trend
- us
- US Dollar
- was
- which
- with
- Your
- zephyrnet