Bitcoin price attempted a fresh increase above the $26,500 resistance. However, BTC failed to settle above $26,700 and reacted to the downside.
- Bitcoin is still struggling to clear $26,500 and $26,700.
- The price is trading above $26,200 and the 100 hourly Simple moving average.
- There is a connecting bullish trend line forming with support near $26,200 on the hourly chart of the BTC/USD pair (data feed from Kraken).
- The pair could again climb higher unless there is a close below $26,200 and $26,000.
Bitcoin Price Faces Uphill Task
Bitcoin price started a decent recovery wave from the $26,000 support zone. BTC climbed higher above the $26,350 and $26,500 resistance levels.
The price even spiked above the $26,700 resistance. However, the bears defended more gains. A high was formed near $26,818 and there was a strong rejection pattern. The price trimmed all gains and declined below the $26,500 level.
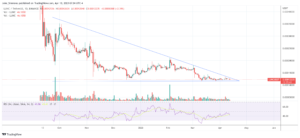
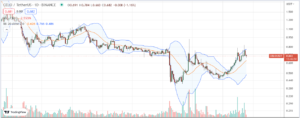
It even dived below $26,200. A low is formed near $26,100 and the price is now attempting a fresh increase. Bitcoin is trading above $26,200 and the 100 hourly Simple moving average. There is also a connecting bullish trend line forming with support near $26,200 on the hourly chart of the BTC/USD pair.
Immediate resistance on the upside is near the $26,450 level. It is close to the 50% Fib retracement level of the downward move from the $26,818 swing high to the $26,100 low.

Source: BTCUSD on TradingView.com
The next key resistance could be near the $26,650 level or the 76.4% Fib retracement level of the downward move from the $26,818 swing high to the $26,100 low. To start a recovery wave, the price must settle above $26,650. In the stated case, the price could climb toward the $27,000 resistance. Any more gains might call for a move toward the $27,500 level.
Another Decline In BTC?
If Bitcoin fails to start a fresh increase above the $26,450 resistance, it could start another decline. Immediate support on the downside is near the $26,200 level and the trend line.
The next major support is near the $26,000 level. A downside break and close below the $26,000 level might start another major decline. The next support sits at $25,400. Any more losses might call for a test of $25,000.
Technical indicators:
Hourly MACD – The MACD is now losing pace in the bearish zone.
Hourly RSI (Relative Strength Index) – The RSI for BTC/USD is now above the 50 level.
Major Support Levels – $26,200, followed by $26,000.
Major Resistance Levels – $26,450, $26,650, and $27,000.
- SEO Powered Content & PR Distribution. Get Amplified Today.
- PlatoData.Network Vertical Generative Ai. Empower Yourself. Access Here.
- PlatoAiStream. Web3 Intelligence. Knowledge Amplified. Access Here.
- PlatoESG. Carbon, CleanTech, Energy, Environment, Solar, Waste Management. Access Here.
- PlatoHealth. Biotech and Clinical Trials Intelligence. Access Here.
- Source: https://www.newsbtc.com/analysis/btc/bitcoin-bulls-keep-pushing-26k/
- :is
- 000
- 1
- 100
- 200
- 400
- 50
- 500
- 700
- a
- above
- again
- All
- also
- and
- Another
- any
- At
- attempted
- attempting
- average
- BE
- bearish
- Bears
- below
- Bitcoin
- bitcoin bulls
- Bitcoin Price
- Break
- BTC
- BTC/USD
- Bullish
- Bulls
- but
- by
- call
- case
- Chart
- clear
- climb
- Climbed
- Close
- Connecting
- could
- data
- decent
- Decline
- downside
- downward
- Even
- faces
- Failed
- fails
- followed
- For
- formed
- fresh
- fresh increase
- from
- Gains
- High
- higher
- However
- HTTPS
- immediate
- in
- Increase
- index
- Indicators
- IT
- Keep
- Key
- key resistance
- Kraken
- Level
- levels
- Line
- losing
- losses
- Low
- MACD
- major
- max-width
- might
- more
- move
- moving
- moving average
- must
- Near
- NewsBTC
- next
- now
- of
- on
- or
- Pace
- pair
- Pattern
- plato
- Plato Data Intelligence
- PlatoData
- price
- Pushing
- recovery
- relative
- relative strength index
- Resistance
- retracement
- rsi
- settle
- Simple
- sits
- SMA
- start
- started
- stated
- Still
- strength
- strong
- Struggling
- support
- support levels
- Swing
- test
- The
- There.
- to
- toward
- Trading
- TradingView
- Trend
- Upside
- was
- Wave
- with
- zephyrnet