Bitcoin price rallied above the $27,500 resistance. BTC is consolidating near $28,000 and might start a minor downside correction in the near term.
- Bitcoin gained pace above the $27,200 and $27,500 resistance levels.
- The price is trading above $27,500 and the 100 hourly Simple moving average.
- There is a key bullish trend line forming with support near $27,350 on the hourly chart of the BTC/USD pair (data feed from Kraken).
- The pair is signaling more gains above $28,000 after a mild downside correction.
Bitcoin Price Rallies To $28K
Bitcoin price started a decent increase above the $27,000 resistance zone. BTC gained pace for a move above the $27,200 and $27,500 resistance levels.
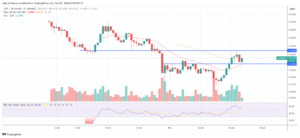
The upward move was such that the price even tested the $28,000 resistance. A high is formed near $28,087 and the price is now consolidating gains. It is trading well above the 23.6% Fib retracement level of the upward move from the $26,692 swing low to the $28,087 high.
Bitcoin is trading above $27,500 and the 100 hourly Simple moving average. There is also a key bullish trend line forming with support near $27,350 on the hourly chart of the BTC/USD pair. The trend line is near the 50% Fib retracement level of the upward move from the $26,692 swing low to the $28,087 high.
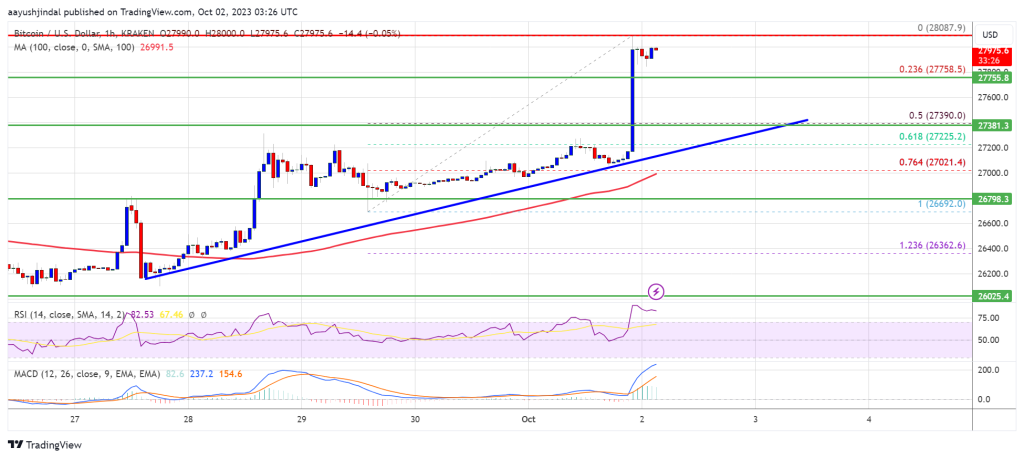
Source: BTCUSD on TradingView.com
Immediate resistance on the upside is near the $28,000 level. The next key resistance could be near the $28,200 level. A close above the $28,200 resistance could send the price further higher. In the stated case, the price could climb toward the $28,800 resistance. Any more gains might call for a move toward the $29,500 level.
Are Dips Supported In BTC?
If Bitcoin fails to continue higher above the $28,000 resistance, there could be a downside correction. Immediate support on the downside is near the $27,750 level.
The next major support is near the $27,350 level or and the trend line. A downside break and close below the $27,350 level might send the price toward $27,000. The next support sits at $26,750. Any more losses might call for a test of $26,200.
Technical indicators:
Hourly MACD – The MACD is now losing pace in the bullish zone.
Hourly RSI (Relative Strength Index) – The RSI for BTC/USD is now above the 50 level.
Major Support Levels – $27,750, followed by $27,350.
Major Resistance Levels – $28,000, $28,200, and $28,800.
- SEO Powered Content & PR Distribution. Get Amplified Today.
- PlatoData.Network Vertical Generative Ai. Empower Yourself. Access Here.
- PlatoAiStream. Web3 Intelligence. Knowledge Amplified. Access Here.
- PlatoESG. Carbon, CleanTech, Energy, Environment, Solar, Waste Management. Access Here.
- PlatoHealth. Biotech and Clinical Trials Intelligence. Access Here.
- Source: https://www.newsbtc.com/analysis/btc/bitcoin-bulls-aim-big-28k/
- :is
- 000
- 1
- 100
- 200
- 23
- 50
- 500
- a
- above
- After
- aim
- also
- and
- any
- At
- average
- BE
- below
- Big
- Bitcoin
- bitcoin bulls
- Bitcoin Price
- Break
- BTC
- BTC/USD
- Bullish
- Bulls
- by
- call
- case
- Chart
- climb
- Close
- consolidating
- continue
- could
- data
- downside
- Ether (ETH)
- Even
- fails
- followed
- For
- formed
- from
- further
- gained
- Gains
- High
- higher
- HTTPS
- immediate
- in
- Increase
- index
- Indicators
- IT
- Key
- key resistance
- Kraken
- Level
- levels
- Line
- losing
- losses
- Low
- MACD
- major
- max-width
- might
- mild
- minor
- more
- move
- moving
- moving average
- Near
- NewsBTC
- next
- now
- of
- on
- or
- Pace
- pair
- plato
- Plato Data Intelligence
- PlatoData
- price
- rallies
- recent
- relative
- relative strength index
- Resistance
- retracement
- rsi
- send
- Simple
- sits
- start
- started
- stated
- strength
- such
- support
- support levels
- Supported
- surge
- Swing
- term
- test
- tested
- that
- The
- There.
- to
- toward
- Trading
- TradingView
- Trend
- Upside
- upward
- was
- WELL
- with
- zephyrnet