Published 3 hours ago
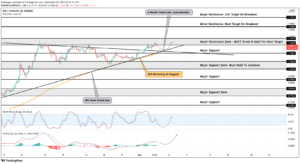
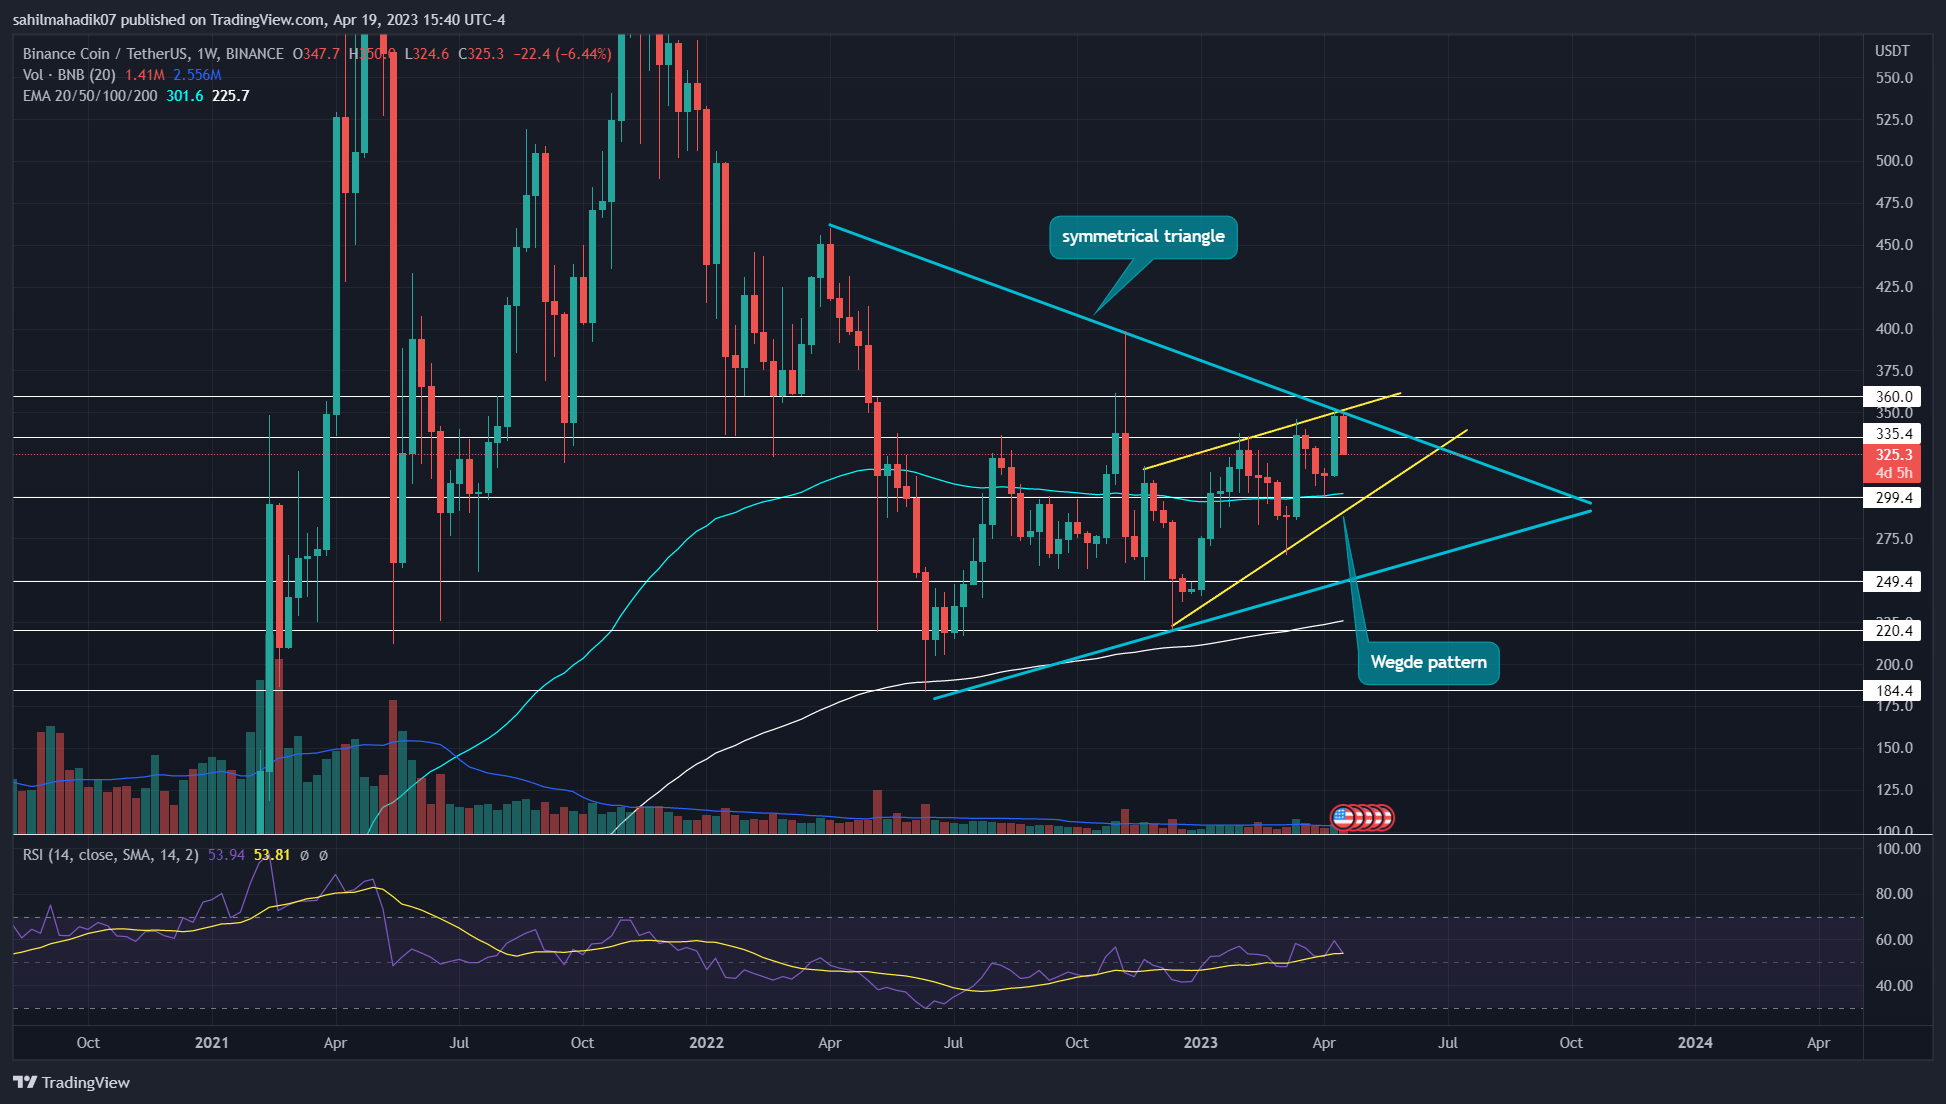
Binance Coin Price Prediction: The Binance coin price is currently responding to two chart patterns in the daily time frame chart. For its overall sideways trendline, the coin price is following a symmetrical triangle(marked in blue). However, for the ongoing recovery within this triangle structure, the prices respect a rising wedge pattern(marked in yellow). Here’s how these patterns will further influence the BNB price for near-future growth.
advertisement
Key points:
- A symmetrical triangle pattern is a continuation pattern whose breakout from either of its trendline will bolster the future price movement
- A rising wedge pattern maintains a strong recovery within two rising trendlines until the lower one breaks.
- The intraday trading volume in the BNB coin is $797.4 Million, indicating a 7% loss
Source- Tradingview
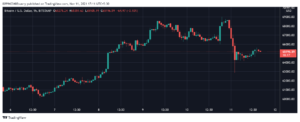
On April 16th, the BNB price turned down from the confluence point for two resistance trendlines mentioned above. With the increasing selling pressure in the market, the coin price tumbled 7% in the last three days and is currently trading at $325.3.
With sustained selling the coin price is likely to tumble 8% where it will hit the support trendline of the wedge pattern. Now until this pattern is intact, the ongoing recovery cycle within the triangle will remain intact and may encourage buyers to breach the symmetrical triangle resistance trendline.
Trending Stories
Also Read: 15 New Cryptocurrencies To Buy In 2023
A potential bullish breakout from the triangle’s resistance trendline will signal an early sign of an upcoming bull rally.
On the contrary, note, if the falling prices breached the wedge pattern support trendline, the BNB coin may witness further correction to the triangle pattern’s support trendline. Thus, the wedge pattern breakdown will thus prolong the long coming sideways trend,
Technical Indicators
EMAs: The 200 EMA of the weekly chart maintains an overall bullish trend for BNB price.
Relative strength index: The weekly RSI slope making new higher highs despite a sideways price action indicates the underlying buying pressure is growing which may increase the possibility of the triangle pattern breakout.
- Spot rate: $325
- Trend: Bearish
- Volatility: Medium
- Resistance level- $325 and $360
- Support level- $300 ad $283
Share this article on:
advertisement
The presented content may include the personal opinion of the author and is subject to market condition. Do your market research before investing in cryptocurrencies. The author or the publication does not hold any responsibility for your personal financial loss.
- SEO Powered Content & PR Distribution. Get Amplified Today.
- Platoblockchain. Web3 Metaverse Intelligence. Knowledge Amplified. Access Here.
- Minting the Future w Adryenn Ashley. Access Here.
- Source: https://coingape.com/markets/binance-coin-price-prediction-bnb-price-poised-for-8-drop-but-there-catch/
- :is
- 1
- 10
- 7
- 8
- 9
- a
- above
- Action
- Ad
- and
- any
- April
- article
- At
- author
- avatar
- banner
- Beauty
- before
- binance
- Binance Coin
- Binance Coin Price
- blockchain
- Blue
- bnb
- BNB coin
- BNB Price
- bolster
- breach
- Breakdown
- breakout
- breaks
- Brian
- bull
- Bullish
- buy
- buyers
- Buying
- Catch
- Chart
- Coin
- Coingape
- COM
- coming
- condition
- content
- continuation
- contrary
- cryptocurrencies
- cryptocurrency
- Currently
- cycle
- daily
- Days
- Despite
- different
- down
- Drop
- Early
- either
- encourage
- Entertainment
- Ether (ETH)
- Falling
- Fashion
- finance
- financial
- follow
- following
- For
- FRAME
- from
- further
- future
- Future Price
- Growing
- Growth
- Have
- higher
- Highs
- Hit
- hold
- HOURS
- How
- However
- HTTPS
- i
- in
- include
- Including
- Increase
- increasing
- index
- indicates
- indicating
- influence
- investing
- IT
- ITS
- journalism
- jpg
- Last
- likely
- Long
- loss
- maintains
- Making
- marked
- Market
- market research
- May..
- mentioned
- million
- New
- of
- on
- ONE
- ongoing
- Opinion
- overall
- past
- Pattern
- patterns
- personal
- plato
- Plato Data Intelligence
- PlatoData
- plugin
- Point
- points
- possibility
- potential
- prediction
- presented
- pressure
- price
- PRICE ACTION
- Price Prediction
- Prices
- Publication
- rally
- Rate
- Read
- recovery
- remain
- research
- Resistance
- respect
- responding
- responsibility
- rising
- Selling
- Share
- sideways
- sign
- Signal
- strength
- strong
- structure
- subject
- support
- Symmetrical Triangle
- The
- The Future
- The Weekly
- These
- this week
- three
- time
- to
- Topics
- Trading
- trading volume
- TradingView
- Trend
- trending
- Turned
- underlying
- upcoming
- variety
- volume
- week
- weekly
- which
- will
- with
- within
- witness
- working
- written
- years
- Your
- zephyrnet