- The key US benchmark stock index, S&P 500 has entered a new bull market.
- Market breadth has seen some signs of improvement as prior cyclical laggards; Energy, Industrials, and Financials sectors outperformed last week.
- Several elements such as rising sovereign bond yields, a steeper US Treasury yield curve inversion, and underperformance of Quality and Momentum beta factors raise concerns about the sustainability of the current bull market.
Last week, the key US benchmark stock index, S&P 500 finally exited its recent bear market of 282 days from its 3 January 2022 all-time high closing level to 12 October 2022 and kickstarted a fresh bull market as it rallied by at least 20% from its October 2022 low.
The improving breadth factor may indicate that this newly born bull market of the S&P 500 has the legs to push higher versus prior “false bull markets” (low to close) of 22 March 2001 to 21 May 2001, 21 September 2001 to 13 November 2001, and 20 November 2008 to 2 January 2009 where the market resumed its downtrend and broke into new respective lows.
Last week, the laggard cyclical-oriented sectors of the S&P 500; Energy (+1.71%), Industrials (+1.38%), and Financials (+1.05%) outperformed in terms of weekly returns over the S&P 500 (+0.39%) as well as the year-to-date high-flying Technology sector (-0.66%) that has led the rally since the October 2022 low.
However, do allow me to be the devil’s advocate to highlight several inherent risks that the current minted bull market of the S&P 500 may not live up to its initial bullish expectations.
Rising sovereign bond yields

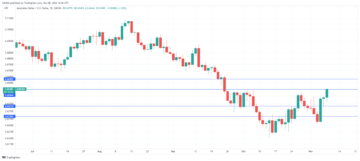
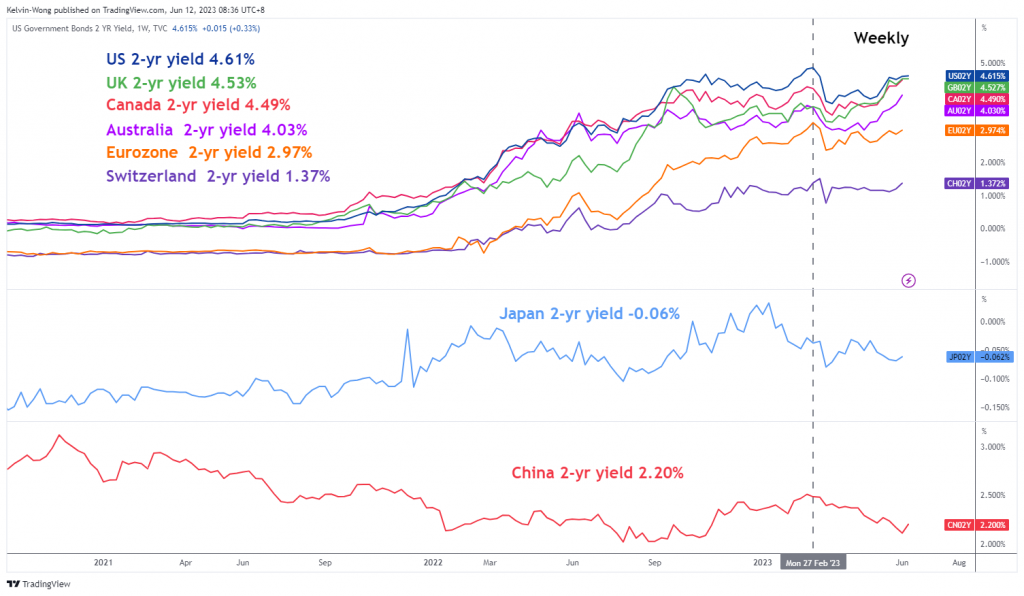
Fig 1: G-20 2-year sovereign bond yields medium-term trend as of 12 Jun 2023 (Source: TradingView, click to enlarge chart)
Except for Japan and China, the other major G-20 nations’ 2-year sovereign bond yields have started to resume their ascend in the past two weeks with the UK, Canada, and Australia’s 2-year sovereign yields breaking above their respective February 2023 highs, the up moves in the latter two countries sovereign yields have been supported by renewed interest rates hikes from their respective central banks, BoC and RBA.
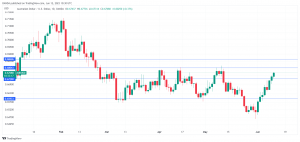
The US 2-year Treasury yield is now trading at 4.61% at this time of the writing, just a whisker away from its 27 February 2023 swing high closing level of 4.86%. Also, technical analysis suggests that positive momentum has started to built-up, and the next key resistance is coming in at a higher level of 5.20%.

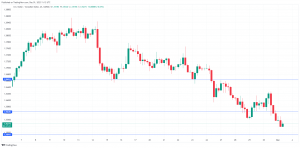
Fig 2: US 2-year Treasury yield medium-term trend as of 12 Jun 2023 (Source: TradingView, click to enlarge chart)
These observations suggest that the medium-term cost of funding for corporations may start to creep up in the second half of 2023.
US Treasury yield curve inversion (10-YR over 2-YR) is the steepest in almost 42 years

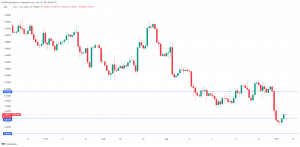
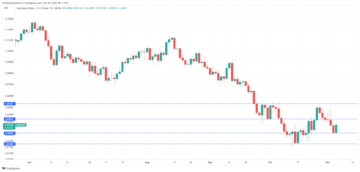
Fig 3: US 10-year over 2-year Treasury yield spread major trend as of 12 Jun 2023 (Source: TradingView, click to enlarge chart)
The inverted US Treasury yield curve measured by the 10-year minus the 2-year has continued to plummet lower to -0.84% at this time of the writing, that’s the steepest inversion level since July 1981 and the MACD trend indicator of the US Treasury 10-year over 2-year yield curve spread is not showing any signs of a potential bullish trend reversal at this juncture.
Thus, further economic weakness in the US and even a recession cannot be ruled out in the later half of 2023.
Based on the latest data from FactSet as of 9 June 2023, analysts now expect estimated Q3 2023 earnings of the S&P 500 to recover with a minor growth rate of 0.8% year-on-year after a contraction of -6.4% year-on-year recorded in Q2 2023. For Q4 2023, the estimated earnings growth rate is expected to expand further to 8.2% year-on-year; if the 8.2% earnings growth rate for Q4 turns out as expected, it will mark the highest year-on-year growth rate for the S&P 500 since Q1 2022 at 9.4%.
Given the current optimistic earnings upgrade from analysts that has been contrasted with a potentially higher cost of funding in the second half of the year and further economic weakness ahead, there could be a risk of earnings downward revisions that may put downside pressure on the S&P 500 due to overoptimistic expectations.
S&P 500 quality and momentum factors are not supporting the current bull market
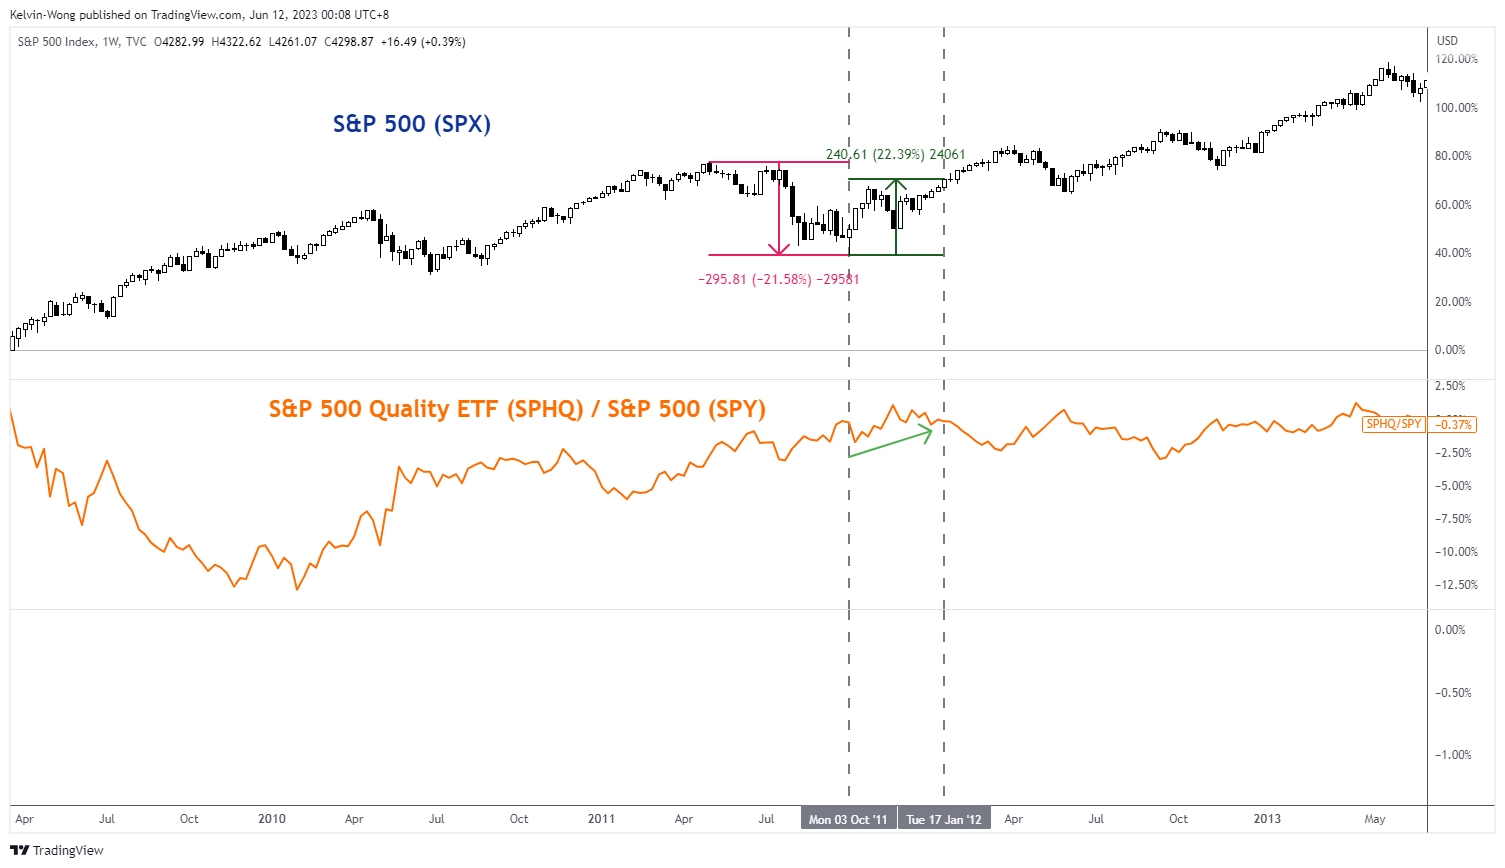


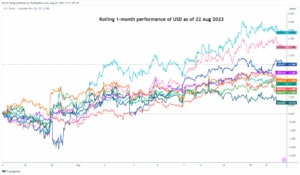
Fig 4: Performance of S&P 500 Quality & Momentum factors against S&P 500 in comparison with prior bull markets within long-term secular uptrend since March 2009 as of 9 Jun 2023
(Source: TradingView, click to enlarge chart)
The period of the observed data on the S&P 500 will be based on its current ongoing long-term secular uptrend phase in place since its March 2009 low that has been primarily supported by the central bank’s liquidity.
The “Quality” and “Momentum” smart beta factors of the S&P 500 are obtained from the Invesco S&P 500 Quality (SPHQ) and Momentum (SPMO) exchange-traded funds; relative strength analysis is applied by plotting their respective price actions over the S&P 500 (ratios of SPHQ/SPY & SPMO/SPY) to gauge underperformance or overperformance against the S&P 500.
A point to note is that the Invesco S&P 500 Momentum ETF is only incepted in October 2015, hence there is no comparison of its SPMO/SPY ratio with the prior birth of a new bull market from October 2011 to 17 January 2012.
Based on the three prior births of a new bull market (defined as low to close) from October 2011 to January 2012, December 2018 to March 2019, and March 2020 to April 2020, both the Quality and Momentum factors outperformed the S&P 500 and in turn saw the benchmark index broke higher highs thereafter.
In contrast, this latest new bull market leg from October 2022 to June 2023 does not see the outperformance of Quality and Momentum factors which may give the current bull run a suspicious doubt on its sustainability.
Overall, these highlighted risk factors are still on the radar screen and prudent risk management techniques are warranted while riding this current new bull market of the S&P 500.
Content is for general information purposes only. It is not investment advice or a solution to buy or sell securities. Opinions are the authors; not necessarily that of OANDA Business Information & Services, Inc. or any of its affiliates, subsidiaries, officers or directors. If you would like to reproduce or redistribute any of the content found on MarketPulse, an award winning forex, commodities and global indices analysis and news site service produced by OANDA Business Information & Services, Inc., please access the RSS feed or contact us at info@marketpulse.com. Visit https://www.marketpulse.com/ to find out more about the beat of the global markets. © 2023 OANDA Business Information & Services Inc.
Latest posts by Kelvin Wong (see all)
- SEO Powered Content & PR Distribution. Get Amplified Today.
- EVM Finance. Unified Interface for Decentralized Finance. Access Here.
- Quantum Media Group. IR/PR Amplified. Access Here.
- PlatoAiStream. Web3 Data Intelligence. Knowledge Amplified. Access Here.
- Source: https://www.marketpulse.com/indices/be-wary-of-the-new-bull-market-of-sp-500/kwong
- :has
- :is
- :not
- :where
- ][p
- $UP
- 1
- 12
- 13
- 15 years
- 15%
- 17
- 2%
- 20
- 2001
- 2008
- 2011
- 2012
- 2015
- 2018
- 2019
- 2020
- 2022
- 2023
- 22
- 27
- 500
- 8
- 9
- a
- About
- above
- access
- actions
- addition
- advice
- advocate
- affiliates
- After
- against
- ahead
- allow
- also
- an
- analysis
- Analysts
- and
- any
- applied
- April
- ARE
- around
- AS
- ascend
- At
- author
- authors
- avatar
- award
- away
- Banks
- based
- BE
- Bear
- Bear Market
- been
- below
- Benchmark
- beta
- BoC
- bond
- Bond yields
- born
- both
- Box
- breadth
- Breaking
- Broke
- bull
- Bull Market
- Bull Run
- Bullish
- business
- buy
- by
- Canada
- cannot
- central
- Central Banks
- Chart
- China
- click
- Close
- closing
- COM
- combination
- coming
- Commodities
- comparison
- Concerns
- conducted
- Connecting
- contact
- content
- continued
- contraction
- contrast
- Corporations
- Cost
- could
- countries
- courses
- Current
- curve
- Cyclical
- data
- Days
- December
- defined
- Directors
- do
- does
- doubt
- downside
- downward
- due
- Earnings
- Economic
- elements
- Elliott
- energy
- enlarge
- entered
- estimated
- ETF
- Ether (ETH)
- Even
- exchange
- exchange-traded
- Expand
- expect
- expectations
- expected
- experience
- expert
- factor
- factors
- February
- Finally
- financial
- financials
- Find
- flow
- For
- foreign
- foreign exchange
- forex
- found
- fresh
- from
- fund
- fundamental
- funding
- funds
- further
- General
- Give
- Global
- global markets
- Growth
- Half
- Have
- hence
- High
- higher
- highest
- Highlight
- Highlighted
- Highs
- Hikes
- HTTPS
- if
- improvement
- improving
- in
- Inc.
- index
- indicate
- Indicator
- Indices
- information
- inherent
- initial
- interest
- Interest Rates
- into
- inversion
- Invesco
- investment
- IT
- ITS
- January
- Japan
- July
- june
- just
- Kelvin
- Key
- key resistance
- kickstarted
- laggards
- Last
- later
- latest
- least
- Led
- legs
- Level
- levels
- like
- Liquidity
- live
- long-term
- Low
- lower
- Lows
- MACD
- Macro
- major
- management
- March
- march 2020
- mark
- Market
- market outlook
- market research
- MarketPulse
- Markets
- max-width
- May..
- measured
- minor
- minted
- Momentum
- more
- moves
- necessarily
- New
- newly
- news
- next
- no
- November
- now
- numerous
- observed
- obtained
- october
- of
- officers
- on
- ongoing
- only
- Opinions
- Optimistic
- or
- Other
- out
- Outlook
- over
- passionate
- past
- performance
- period
- perspectives
- phase
- photo
- Place
- plato
- Plato Data Intelligence
- PlatoData
- please
- Plummet
- Point
- positioning
- positive
- Posts
- potential
- potentially
- pressure
- price
- primarily
- Prior
- Produced
- providing
- purposes
- Push
- put
- Q1
- Q2
- Q3
- quality
- radar
- raise
- rally
- Rate
- Rates
- ratio
- RBA
- recent
- recession
- recorded
- Recover
- relative
- renewed
- research
- Resistance
- respective
- resume
- retail
- returns
- Reversal
- revisions
- riding
- rising
- Risk
- risk factors
- risk management
- risks
- rss
- ruled
- Run
- S&P
- S&P 500
- saw
- Screen
- Second
- sector
- Sectors
- Securities
- see
- seen
- sell
- senior
- September
- service
- Services
- several
- sharing
- showing
- Signs
- since
- Singapore
- site
- smart
- solution
- some
- Source
- sovereign
- specializing
- spread
- start
- started
- Still
- stock
- Stock markets
- Strategist
- strength
- such
- suggest
- Suggests
- Supported
- Supporting
- suspicious
- Sustainability
- Swing
- Technical
- Technical Analysis
- techniques
- Technology
- Technology sector
- ten
- terms
- that
- The
- the UK
- their
- There.
- These
- this
- thousands
- three
- time
- to
- Traders
- Trading
- TradingView
- Training
- treasury
- Trend
- TURN
- turns
- two
- Uk
- unique
- upgrade
- uptrend
- us
- US Treasury
- using
- v1
- Versus
- Visit
- Wave
- weakness
- week
- weekly
- Weeks
- WELL
- which
- while
- will
- winning
- with
- within
- wong
- would
- writing
- year
- years
- Yield
- yield curve
- yields
- you
- zephyrnet