- Australian employment increased by 64,900 in August (2,800 full-time, 62,100 part-time)
- Participation hits 67%, a new high
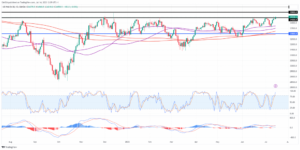
- Is a double bottom forming in AUDUSD?
The Australian jobs data on Thursday was surprisingly good, with the number of new jobs created vastly exceeding expectations, although the bulk were in part-time roles.
Participation also unexpectedly improved, hitting 67% for the first time which will be very welcomed by the central bank as it, and every other one around the world, seeks to defeat inflation while achieving a soft landing. That job will be much easier if the tightness in the labour market is eased through more people joining it, rather than people losing their jobs at higher interest rates bite.
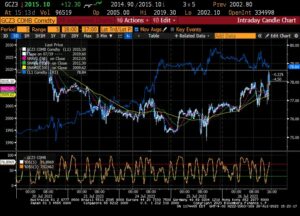
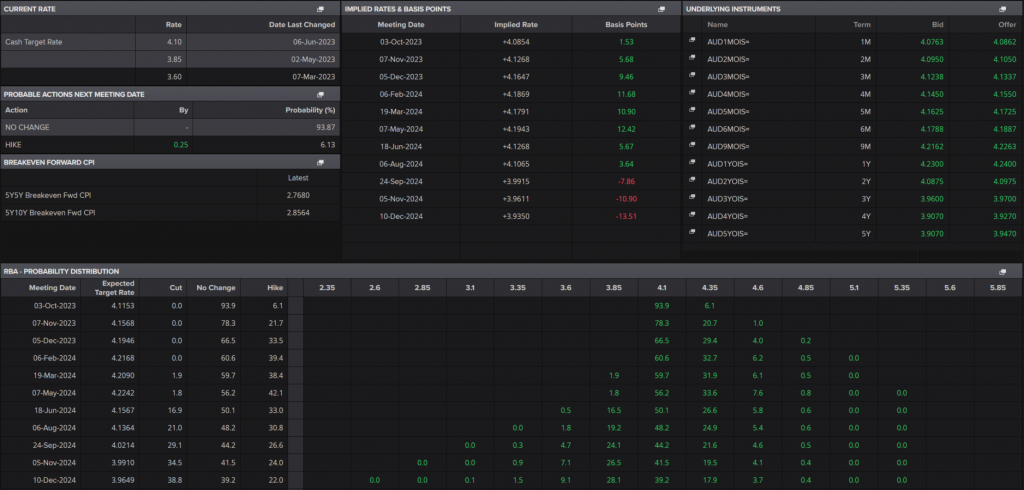
Despite these promising figures, markets are still positioning for another possible rate hike from the RBA over the coming meetings under the new leadership of Governor Michele Bullock. One more hike between now and the middle of next year is around 40% priced in which is arguably quite high under the circumstances.
RBA Interest Rate Probability
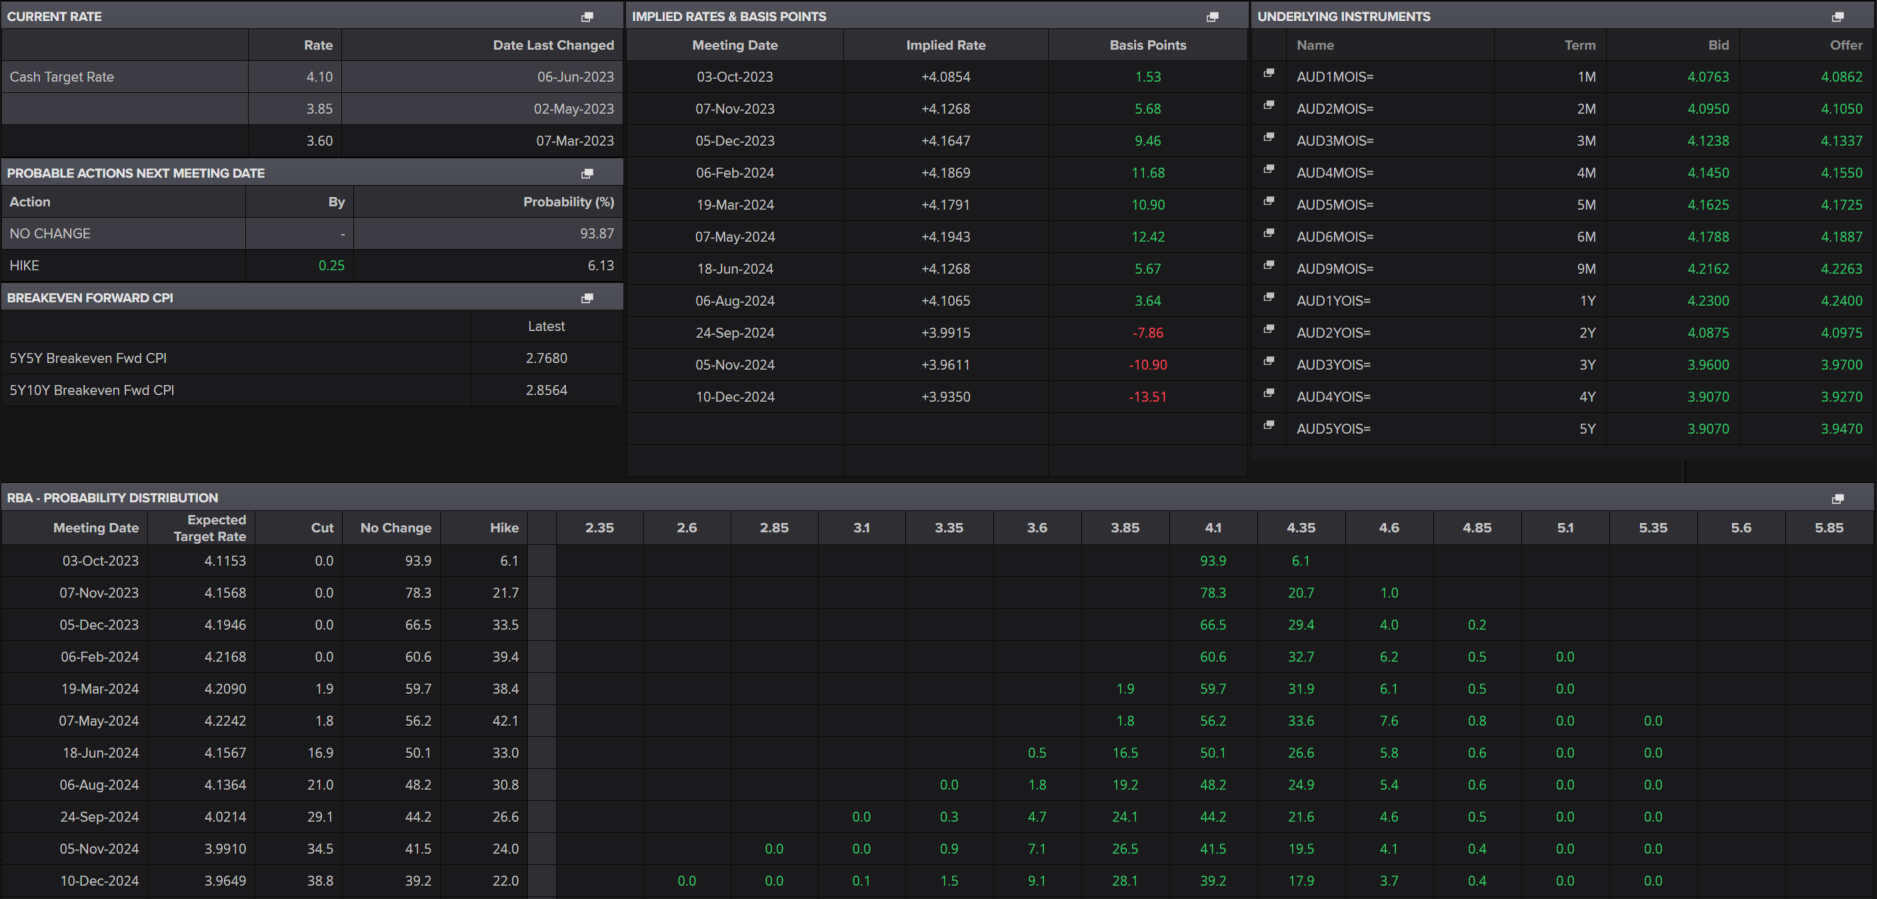
Source – Refinitiv Eikon
[embedded content]
Aussie buoyed by jobs figures
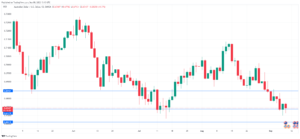
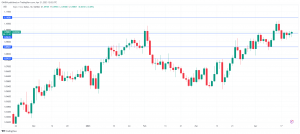
The technical picture in AUDUSD is really quite interesting. On the face of it, it’s been range-bound for the last month and therefore doesn’t look particularly exciting.
But two things stand out. One is the double top that formed between early June and August. The sell-off that followed was quite swift, falling around 230 pips over the following couple of weeks before the consolidation started. But with the double top itself being around 300 pips from the peak to the neckline, is there theoretically more to come? I’m sceptical considering how long it’s been trending sideways but it’s possible.
AUDUSD Daily
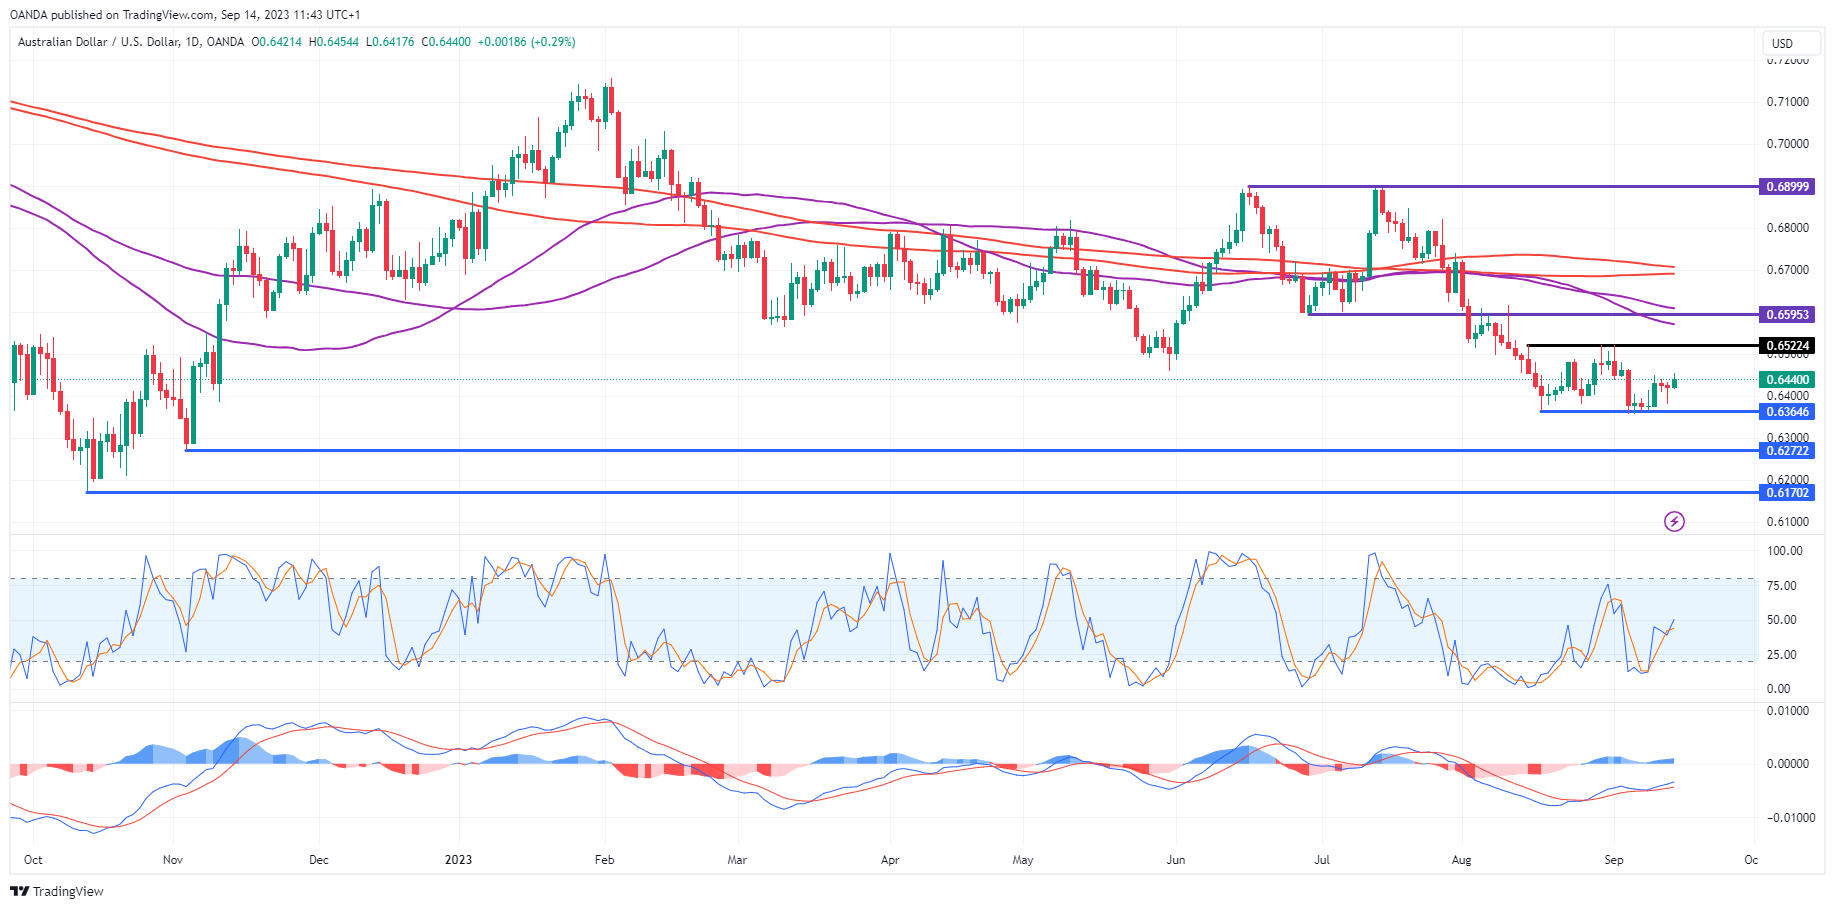
Source – OANDA on Trading View
The second is the potential double bottom that’s now formed during that consolidation period. With the neckline around 0.6520, a break above here could be quite a bullish move and, in theory, offer a possible price projection based on the size of the pattern. Obviously, there are no guarantees but a break of the neckline would make things interesting.
Content is for general information purposes only. It is not investment advice or a solution to buy or sell securities. Opinions are the authors; not necessarily that of OANDA Business Information & Services, Inc. or any of its affiliates, subsidiaries, officers or directors. If you would like to reproduce or redistribute any of the content found on MarketPulse, an award winning forex, commodities and global indices analysis and news site service produced by OANDA Business Information & Services, Inc., please access the RSS feed or contact us at info@marketpulse.com. Visit https://www.marketpulse.com/ to find out more about the beat of the global markets. © 2023 OANDA Business Information & Services Inc.

Latest posts by Craig Erlam (see all)
- SEO Powered Content & PR Distribution. Get Amplified Today.
- PlatoData.Network Vertical Generative Ai. Empower Yourself. Access Here.
- PlatoAiStream. Web3 Intelligence. Knowledge Amplified. Access Here.
- PlatoESG. Automotive / EVs, Carbon, CleanTech, Energy, Environment, Solar, Waste Management. Access Here.
- PlatoHealth. Biotech and Clinical Trials Intelligence. Access Here.
- ChartPrime. Elevate your Trading Game with ChartPrime. Access Here.
- BlockOffsets. Modernizing Environmental Offset Ownership. Access Here.
- Source: https://www.marketpulse.com/forex/aud/aud-usd-buoyed-by-australian-jobs-data-as-markets-consider-one-more-rba-hike/cerlam
- :is
- :not
- 100
- 2015
- 2023
- 300
- a
- About
- above
- access
- achieving
- advice
- affiliates
- also
- Although
- an
- analysis
- analyst
- Analysts
- and
- Another
- any
- ARE
- arguably
- around
- AS
- At
- AUD/USD
- AUGUST
- Australian
- Australian jobs data
- author
- authors
- award
- Bank
- based
- bbc
- BE
- been
- before
- being
- below
- between
- Bloomberg
- both
- Bottom
- Box
- Break
- Bullish
- business
- but
- buttons
- buy
- by
- central
- Central Bank
- Certified
- circumstances
- COM
- come
- coming
- Commentary
- commentator
- Commodities
- Consider
- considering
- consolidation
- contact
- content
- could
- Couple
- Craig
- Craig Erlam
- created
- data
- Directors
- Doesn’t
- double
- double bottom
- during
- Early
- easier
- embedded
- employment
- Ether (ETH)
- Every
- exciting
- expectations
- experience
- Face
- Falling
- Federation
- Figures
- financial
- Financial Market
- Financial Times
- Find
- First
- first time
- focuses
- followed
- following
- For
- forex
- formed
- found
- fox
- Fox Business
- from
- full
- fundamental
- General
- Global
- global markets
- good
- Governor
- guarantees
- Guest
- Have
- he
- here
- High
- higher
- Hike
- his
- Hits
- hitting
- holds
- How
- http
- HTTPS
- if
- improved
- in
- Inc.
- increased
- Indices
- inflation
- information
- interest
- INTEREST RATE
- Interest Rates
- interesting
- International
- international business
- investment
- IT
- ITS
- itself
- Job
- Jobs
- joined
- joining
- jpg
- june
- Labour
- landing
- Last
- Leadership
- like
- London
- Long
- Look
- losing
- Macroeconomic
- make
- many
- Market
- MarketPulse
- Markets
- max-width
- meetings
- membership
- Middle
- Month
- more
- move
- much
- necessarily
- New
- news
- next
- no
- now
- number
- of
- offer
- officers
- on
- ONE
- only
- Opinions
- or
- Other
- out
- over
- particularly
- Pattern
- Peak
- People
- period
- picture
- plato
- Plato Data Intelligence
- PlatoData
- player
- please
- positioning
- possible
- Posts
- potential
- price
- Produced
- producing
- Projection
- promising
- published
- purposes
- Rate
- Rate Hike
- Rates
- rather
- RBA
- really
- recognised
- refinitiv
- regular
- Reuters
- roles
- rss
- Second
- Securities
- Seeks
- sell
- sell-off
- service
- Services
- sharing
- sideways
- site
- Size
- sky
- Society
- Soft
- solution
- stand
- started
- Still
- SWIFT
- Technical
- Technical Analysis
- than
- that
- The
- The Financial Times
- the world
- their
- theory
- There.
- therefore
- These
- things
- Through
- thursday
- time
- times
- to
- top
- trader
- Trading
- trending
- tv
- two
- under
- us
- v1
- very
- Video
- views
- Visit
- was
- Weeks
- welcomed
- were
- which
- while
- will
- winning
- with
- world
- would
- year
- years
- you
- youtube
- zephyrnet