SNEAK PEEK
- The ARB market has been dominated by bears, leading to a price decline.
- Technical indicators suggest a bearish trend, with potential for a brief bounce.
- Market volatility and investor anxiety are impacting ARB’s performance.
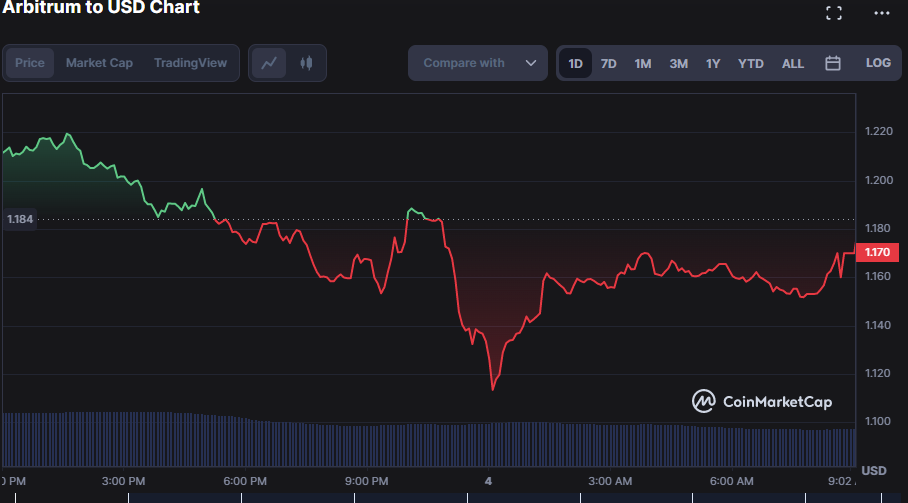
The Arbitrum market (ARB) has been dominated by bears over the past 24 hours, with the price dropping from an intraday high of $1.22 to an intraday low of $1.11. If the bears maintain control, the price of ARB may continue to be under pressure to decline, going by the current bearish market sentiment.
As of press time, the price had dropped from 1.55% to $1.17 due to persistent bearish pressure. Investors profiting from price increases and cashing out on gains resulting from the decline are the causes of increased selling pressure in ARB.
The recession caused a 1.46% decline in market capitalization to $1,485,639,477 and a 28.50% decline in 24-hour trading volume to $809,866,196. This decline can be attributed to investors’ ignorance and anxiety as they observe the ARB market and postpone making significant investments until they see a recovery.
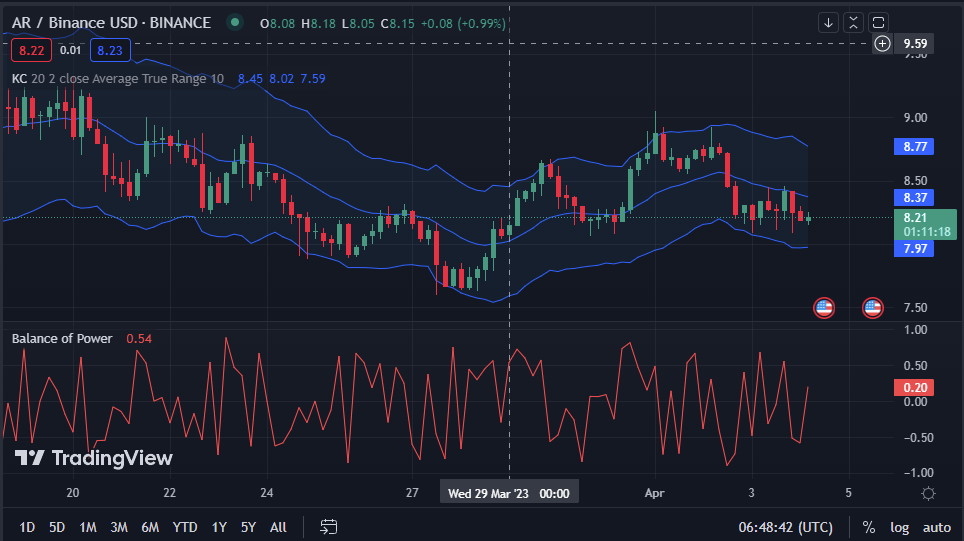
The Balance of Power (BOP) indicator for the ARB market’s 4-hour price chart has a value of 0.43, suggesting increased selling pressure in the market and perhaps the beginning of a bearish trend. Even though ARB has become less expensive, a significant price increase may be coming.
On the ARB market, the Kelter Channels’ (KC) upper and lower values are 8.77 and 7.98, respectively. Based on this movement, the market is clearly in a downtrend. If the price movement crosses the bottom line, it might signify that the trend is still downward and present opportunities for profit-taking or short-selling.
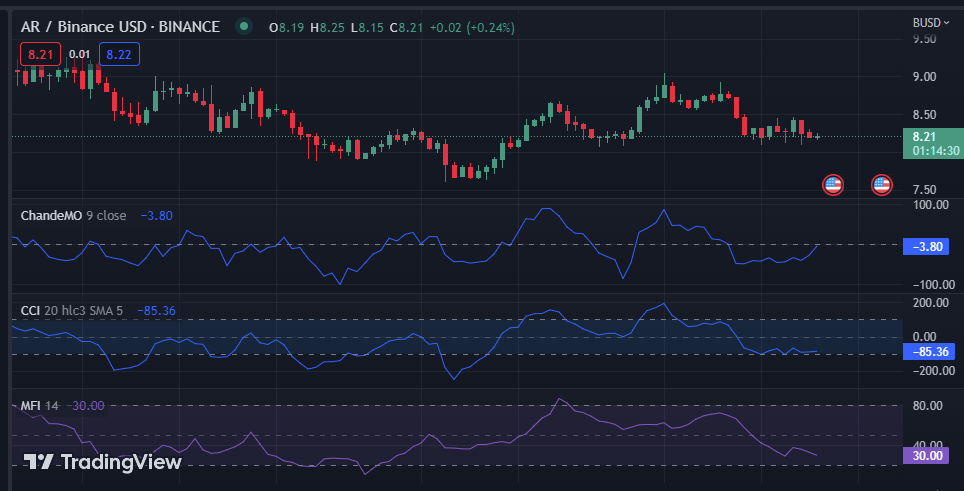
The commodity channel index (CCI), which is negative and has its line pointing south, has a value of -80.89 on the 4-hour price chart for the ARB market. This movement suggests that the market is under heavy selling pressure and that a price reversal will probably happen soon. ARB is less expensive right now, but that could change quickly.
On the ARB market, the Money Flow Index (MFI) line has value of 30.23 and is oriented southward. This motion implies a bearish market, and selling pressure may soon continue. This suggests moderate volatility in the ARB market because prices are most likely to move in a relatively small range.
On the price chart, the Chande Momentum Oscillator (ChandeMO) is south-facing and negative with a value of -1.23. The market price of the asset has recently been dropping quickly. This movement suggests that a brief bounce may be due because the purchase is currently oversold.
The bearish market sentiment in ARB is reflected in the indicators, which suggest a downtrend. There may be a short-term bounce, but the price may continue under pressure.
Disclaimer: The views, opinions, and information shared in this price prediction are published in good faith. Readers must do their research and due diligence. Any action taken by the reader is strictly at their own risk. Coin Edition and its affiliates will not be liable for direct or indirect damage or loss.
- SEO Powered Content & PR Distribution. Get Amplified Today.
- Platoblockchain. Web3 Metaverse Intelligence. Knowledge Amplified. Access Here.
- Source: https://investorbites.com/arbitrum-arb-price-analysis-4-4/
- :is
- 1
- 11
- 28
- 7
- 77
- 8
- 98
- a
- Action
- affiliates
- analysis
- and
- Anxiety
- arbitrum
- ARE
- AS
- asset
- At
- Balance
- based
- BE
- bearish
- bearish market
- Bears
- because
- become
- Beginning
- Bottom
- Bounce
- by
- CAN
- capitalization
- caused
- causes
- change
- Channel
- Chart
- clearly
- Coin
- Coin Edition
- coming
- commodity
- continue
- control
- could
- Current
- Currently
- Decline
- diligence
- direct
- dominate
- downward
- dropped
- Dropping
- edition
- Even
- expensive
- faith
- flow
- For
- from
- Gains
- going
- good
- happen
- heavy
- High
- HOURS
- HTTPS
- Ignorance
- in
- Increase
- increased
- Increases
- index
- Indicator
- Indicators
- information
- internal
- Investments
- investor
- Investors
- IT
- ITS
- leading
- likely
- Line
- loss
- Low
- maintain
- Making
- Market
- Market Capitalization
- Market News
- market sentiment
- might
- Momentum
- money
- most
- motion
- move
- movement
- negative
- news
- observe
- of
- on
- Opinions
- opportunities
- own
- past
- performance
- perhaps
- plato
- Plato Data Intelligence
- PlatoData
- potential
- power
- prediction
- present
- press
- pressure
- price
- Price Analysis
- price chart
- Price Increase
- Price Prediction
- Prices
- probably
- published
- purchase
- quickly
- range
- Reader
- readers
- recently
- recession
- recovery
- reflected
- relatively
- research
- respectively
- resulting
- Reversal
- Risk
- Selling
- sentiment
- shared
- Short-selling
- short-term
- significant
- small
- Soon
- South
- Still
- Suggests
- that
- The
- their
- time
- to
- Trading
- trading volume
- Trend
- under
- value
- Values
- views
- Volatility
- volume
- which
- will
- with
- zephyrnet