The Cypher pattern is a type of advanced chart pattern used in technical analysis to identify potential trend reversals in financial markets.
Key takeaways
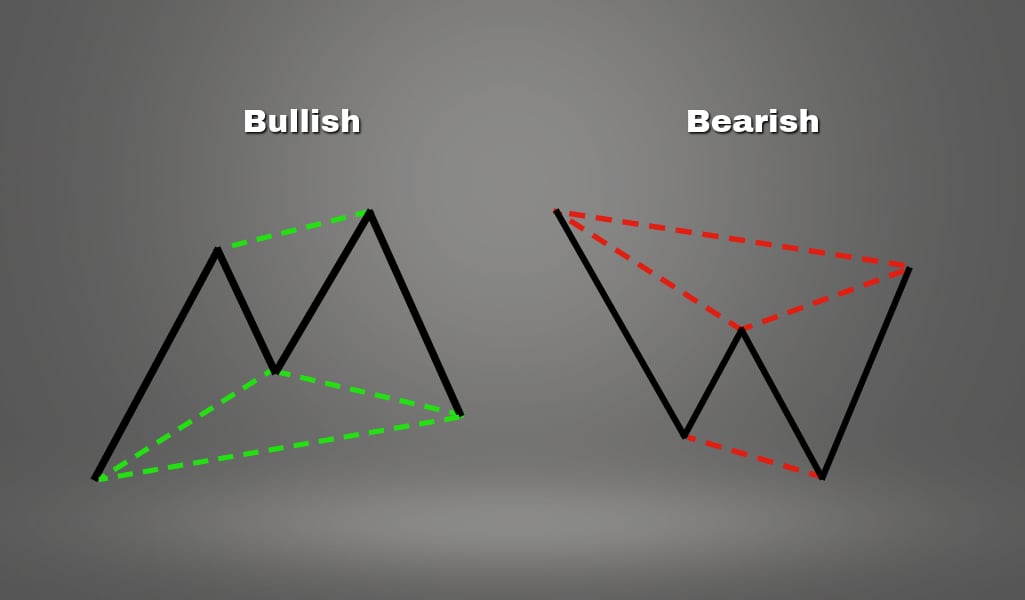
- Cypher pattern consists of five swing points (X, A, B, C, and D) and four legs (XA, AB, BC, CD.)
- The Cypher pattern offers traders a systematic way to identify potential trend reversals.
It falls under the category of “harmonic patterns,” which use Fibonacci levels to define precise turning points. This pattern is particularly favored by traders because of its unique structure and potential to provide clear entry and exit points.
The Cypher pattern consists of five swing points (X, A, B, C, and D) and four legs (XA, AB, BC, CD.) Interestingly, the pattern mentioned above is characterized by an “M” shape when bullish and a “W” shape if bearish. Traders typically place orders at D to catch the potential reversal.
The Cypher pattern, a distinctive configuration in technical analysis, finds significant application in the Forex market due to its precise Fibonacci-based structure. In Forex trading, where currencies are traded in pairs, the pattern’s ability to identify potential reversals is highly valued. Also, it is a good idea to gather more information about various currency pairs.
How to identify a Cypher pattern
To make a long story short, the Cypher pattern includes an impulse leg, XA, that retraces to form AB. Another impulse beyond the swing point A creates the BC leg, and a final retracement to D generates the CD leg.
Here are the Cypher harmonic pattern rules that must also be met:
- AB retraces XA by 38.2% to 61.8%.
- BC extends XA by 127.2% to 141.4%.
- CD retraces XC by 78.6%.
As a reminder, it is fine if the ratios don’t line up exactly.
Trading the Cypher pattern
Identification: First, identify the Cypher pattern on a price chart. Use technical analysis tools to spot the XABCD structure.
Wait for completion: It’s important to wait until the pattern is fully formed at point D. Entering a trade prematurely can lead to false signals.
Entry point: For a Bullish Cypher, enter a long position at point D. For a Bearish Cypher, enter a short position at point D.
Stop loss: Place a stop loss just below point X for a Bullish Cypher or just above point X for a Bearish Cypher. This is to minimize potential losses if the pattern fails.
Profit targets: Common profit-taking points are set at a 38.2% and 61.8% retracement of the CD leg.
Technical analysts, who scrutinize market trends and price actions to forecast future movements, often employ various chart patterns to guide their analysis. Among these, the Cypher pattern has gained prominence for its unique structure and predictive capabilities.
What about common mistakes?
Ignoring Fibonacci Ratios: Not strictly adhering to the Fibonacci levels can lead to misidentification of the pattern.
Overtrading: Don’t force trades. Not every situation will present a perfect Cypher pattern.
Interesting fact
Support and resistance levels and the Cypher pattern share a common foundation in technical analysis, both being tools to identify potential price turnarounds. Support and resistance levels mark where prices historically have reversed, while the Cypher pattern uses Fibonacci retracements to predict such reversals.
Both concepts are rooted in market psychology, reflecting areas where buying and selling pressures converge. They are integral in formulating trading strategies, particularly for pinpointing entry and exit points.
Advanced pattern recognition

Advanced pattern recognition in the context of trading and financial markets refers to the sophisticated process of identifying specific patterns within price data that signify potential trading opportunities. This discipline combines elements of technical analysis, statistics, and machine learning to forecast future price movements based on historical patterns. It’s an essential aspect of modern trading strategies, particularly in markets characterized by high volatility and complexity.
Components of advanced pattern recognition
Technical indicators and chart patterns: These are the foundation of pattern recognition. Advanced methods use a combination of various technical indicators (like moving averages, RSI, MACD) and chart patterns (like head and shoulders, triangles, or flags) to spot potential trading opportunities.
Machine learning and AI: Machine learning algorithms, particularly those in the realm of artificial intelligence, can analyze vast amounts of market data to identify patterns that might be imperceptible to the human eye. They can adapt to changing market conditions, learning from new data to refine their pattern recognition capabilities.
Statistical analysis: This involves applying statistical techniques to price data to identify probable outcomes based on historical patterns. Statistical tools can quantify the strength and reliability of identified patterns.
Backtesting: An integral part of advanced pattern recognition, backtesting involves applying pattern recognition algorithms to historical data to evaluate their effectiveness. It helps traders understand the potential profitability and risks of trading strategies based on identified patterns.
Real-time analysis: Advanced pattern recognition is not just about analyzing historical data but also about applying these insights in real-time. This involves continuously scanning market data as it’s generated to identify trading opportunities instantly.
Important details
Interestingly, the Cypher pattern in technical analysis is a chart formation identified using Fibonacci retracement levels. Traders use these Fibonacci levels to predict potential reversal points in price movements, as the Cypher pattern’s turning points often align with key Fibonacci ratios, aiding in identifying entry and exit points in trading.
Swing trading and Cypher pattern
Swing trading and the Cypher pattern are both popular concepts in the world of technical trading, and they intersect in several meaningful ways. While swing trading is a strategy focused on capturing gains in a stock (or any financial instrument) within an over-night to several weeks timeframe, the Cypher pattern is a specific type of technical analysis tool used to predict price movements.
Swing trading is a style of trading that attempts to capture short- to medium-term gains in a stock or financial instrument over a period of a few days to several weeks. Swing traders primarily use technical analysis to look for trading opportunities. These traders may utilize fundamental analysis in addition to analyzing price trends and patterns.
The Cypher pattern: A key tool for swing traders
The Cypher pattern, a harmonic pattern in technical analysis, is particularly well-suited for swing trading for several reasons:
Timeframe compatibility: The Cypher pattern typically unfolds over a period that aligns well with the swing trading timeframe. It’s common for the formation of this pattern to span several days or weeks, matching the typical holding period for swing trades.
Identifying reversal points: Swing traders often look for potential reversal points in the market to enter and exit trades. The Cypher pattern, with its distinct Fibonacci ratios and structured formation, can signal impending reversals, providing valuable entry and exit points for swing traders.
Risk management: The clear definition of entry, stop loss, and profit target levels in the Cypher pattern aligns with the disciplined approach to risk management essential in swing trading. Traders can set precise parameters for managing their trades, a crucial aspect of successful swing trading.
Enhancing strategy: Incorporating the Cypher pattern into swing trading can enhance a trader’s strategy, offering a systematic way to identify potential trades. This pattern, combined with other technical analysis tools and fundamental analysis, can provide a more comprehensive trading strategy.
Head and shoulders pattern
The Head and Shoulders pattern is a highly regarded and widely recognized chart formation in technical analysis, often signaling a potential reversal of a prevailing trend. This pattern typically appears in an uptrend and consists of three peaks: the left shoulder, the head, and the right shoulder. The left shoulder forms as the price rises to a new high and then falls back.
The head is formed by a higher peak followed by a decline, and the right shoulder is a lower peak followed by a final decline. The key to this pattern is the “neckline,” drawn by connecting the lowest points of the two troughs between the three peaks.
A completion of the pattern is confirmed when the price breaks below the neckline after forming the right shoulder. This break is interpreted as a signal of a potential bearish reversal, indicating that the previous uptrend may be transitioning into a downtrend. Traders often use this pattern to make decisions about entering short positions or exiting long positions. The reliability of the Head and Shoulders pattern makes it a staple in the repertoire of many traders, underlining its significance in the study of market psychology and supply and demand dynamics.
In conclusion, the Cypher pattern, with its distinct structure and reliance on Fibonacci ratios, offers traders a systematic way to identify potential trend reversals. Like all trading strategies, it requires practice, patience, and a sound approach to risk management. By mastering the identification and trading of this pattern, traders can potentially enhance their trading performance in various financial markets.
- SEO Powered Content & PR Distribution. Get Amplified Today.
- PlatoData.Network Vertical Generative Ai. Empower Yourself. Access Here.
- PlatoAiStream. Web3 Intelligence. Knowledge Amplified. Access Here.
- PlatoESG. Carbon, CleanTech, Energy, Environment, Solar, Waste Management. Access Here.
- PlatoHealth. Biotech and Clinical Trials Intelligence. Access Here.
- Source: https://www.financebrokerage.com/cypher-pattern/
- :has
- :is
- :not
- :where
- $UP
- 2%
- a
- ability
- About
- above
- actions
- adapt
- addition
- adhering
- advanced
- After
- algorithms
- align
- Aligns
- All
- also
- among
- amounts
- an
- analysis
- Analysts
- analyze
- analyzing
- and
- Another
- any
- appears
- Application
- Applying
- approach
- ARE
- areas
- artificial
- artificial intelligence
- AS
- aspect
- At
- Attempts
- b
- back
- Backtesting
- based
- BE
- bearish
- because
- being
- below
- between
- Beyond
- both
- Break
- breaks
- Bullish
- but
- Buying
- by
- CAN
- capabilities
- capture
- Capturing
- Catch
- Category
- CD
- changing
- characterized
- Chart
- clear
- combination
- combined
- combines
- Common
- compatibility
- completion
- complexity
- comprehensive
- concepts
- conclusion
- conditions
- Configuration
- CONFIRMED
- Connecting
- consists
- context
- continuously
- converge
- creates
- crucial
- currencies
- Currency
- currency pairs
- cypher
- data
- Days
- decisions
- Decline
- define
- definition
- Demand
- discipline
- disciplined
- distinct
- distinctive
- Dont
- drawn
- due
- dynamics
- effectiveness
- elements
- enhance
- Enter
- entering
- entry
- essential
- Ether (ETH)
- evaluate
- Every
- exactly
- Exit
- Exiting
- extends
- eye
- fails
- Falls
- false
- few
- Fibonacci
- Fibonacci retracement levels
- final
- financial
- finds
- fine
- First
- five
- flags
- focused
- followed
- For
- Force
- Forecast
- forex
- forex market
- form
- formation
- formed
- forms
- formulating
- Foundation
- four
- from
- fully
- fundamental
- future
- Future Price
- gained
- Gains
- gather
- generated
- generates
- good
- guide
- Have
- head
- helps
- High
- higher
- highly
- historical
- historically
- holding
- HTTPS
- human
- idea
- Identification
- identified
- identify
- identifying
- if
- impending
- important
- in
- includes
- incorporating
- indicating
- Indicators
- information
- insights
- instantly
- instrument
- integral
- Intelligence
- intersect
- into
- involves
- IT
- ITS
- jpg
- just
- Key
- lead
- learning
- left
- legs
- levels
- like
- Line
- Long
- Look
- loss
- losses
- lower
- lowest
- MACD
- machine
- machine learning
- make
- MAKES
- management
- managing
- many
- mark
- Market
- market conditions
- Market Data
- Market Trends
- Markets
- Mastering
- matching
- May..
- meaningful
- mentioned
- met
- methods
- might
- minimize
- mistakes
- Modern
- more
- movements
- moving
- moving averages
- must
- New
- of
- offering
- Offers
- often
- on
- opportunities
- or
- orders
- Other
- outcomes
- over
- pairs
- parameters
- part
- particularly
- Patience
- Pattern
- patterns
- Peak
- perfect
- performance
- period
- Place
- plato
- Plato Data Intelligence
- PlatoData
- Point
- points
- Popular
- position
- positions
- potential
- potentially
- practice
- precise
- predict
- predictive
- present
- previous
- price
- price chart
- Prices
- primarily
- process
- Profit
- profitability
- prominence
- provide
- providing
- Psychology
- real-time
- realm
- reasons
- recognition
- recognized
- refers
- refine
- reflecting
- regarded
- reliability
- reliance
- reminder
- requires
- Resistance
- retracement
- Reversal
- right
- Rises
- Risk
- risk management
- risks
- rooted
- rsi
- rules
- scanning
- Selling
- set
- several
- Shape
- Share
- Short
- shoulders
- Signal
- signals
- significance
- significant
- signify
- situation
- sophisticated
- Sound
- span
- specific
- Spot
- statistical
- statistics
- stock
- Stop
- Story
- strategies
- Strategy
- strength
- structure
- structured
- Study
- style
- successful
- such
- supply
- Supply and Demand
- support
- Swing
- Swing Traders
- Target
- Technical
- Technical Analysis
- techniques
- that
- The
- the world
- their
- then
- These
- they
- this
- those
- three
- timeframe
- to
- tool
- tools
- trade
- traded
- Traders
- trades
- Trading
- Trading Strategies
- trading strategy
- transitioning
- Trend
- Trends
- true
- turnarounds
- Turning
- two
- type
- typical
- typically
- under
- understand
- unique
- until
- uptrend
- use
- used
- uses
- using
- utilize
- Valuable
- valued
- various
- Vast
- Volatility
- wait
- Way..
- ways
- webp
- Weeks
- WELL
- when
- which
- while
- WHO
- widely
- will
- with
- within
- world
- X
- zephyrnet