Published 2 hours ago
From Mid-April, the crypto market witnessed a significant sell-off which initiated a correction phase in the majority of major cryptocurrencies. This retracement was triggered when the Leading cryptocurrency Bitcoin failed to sustain above the $30000 price level. Anyhow, with the overall market trend bullish, interested traders can refer to the following coins as they show a strong chart setup to undermine the bearish momentum in the near future.
advertisement
Binance coin(BNB)
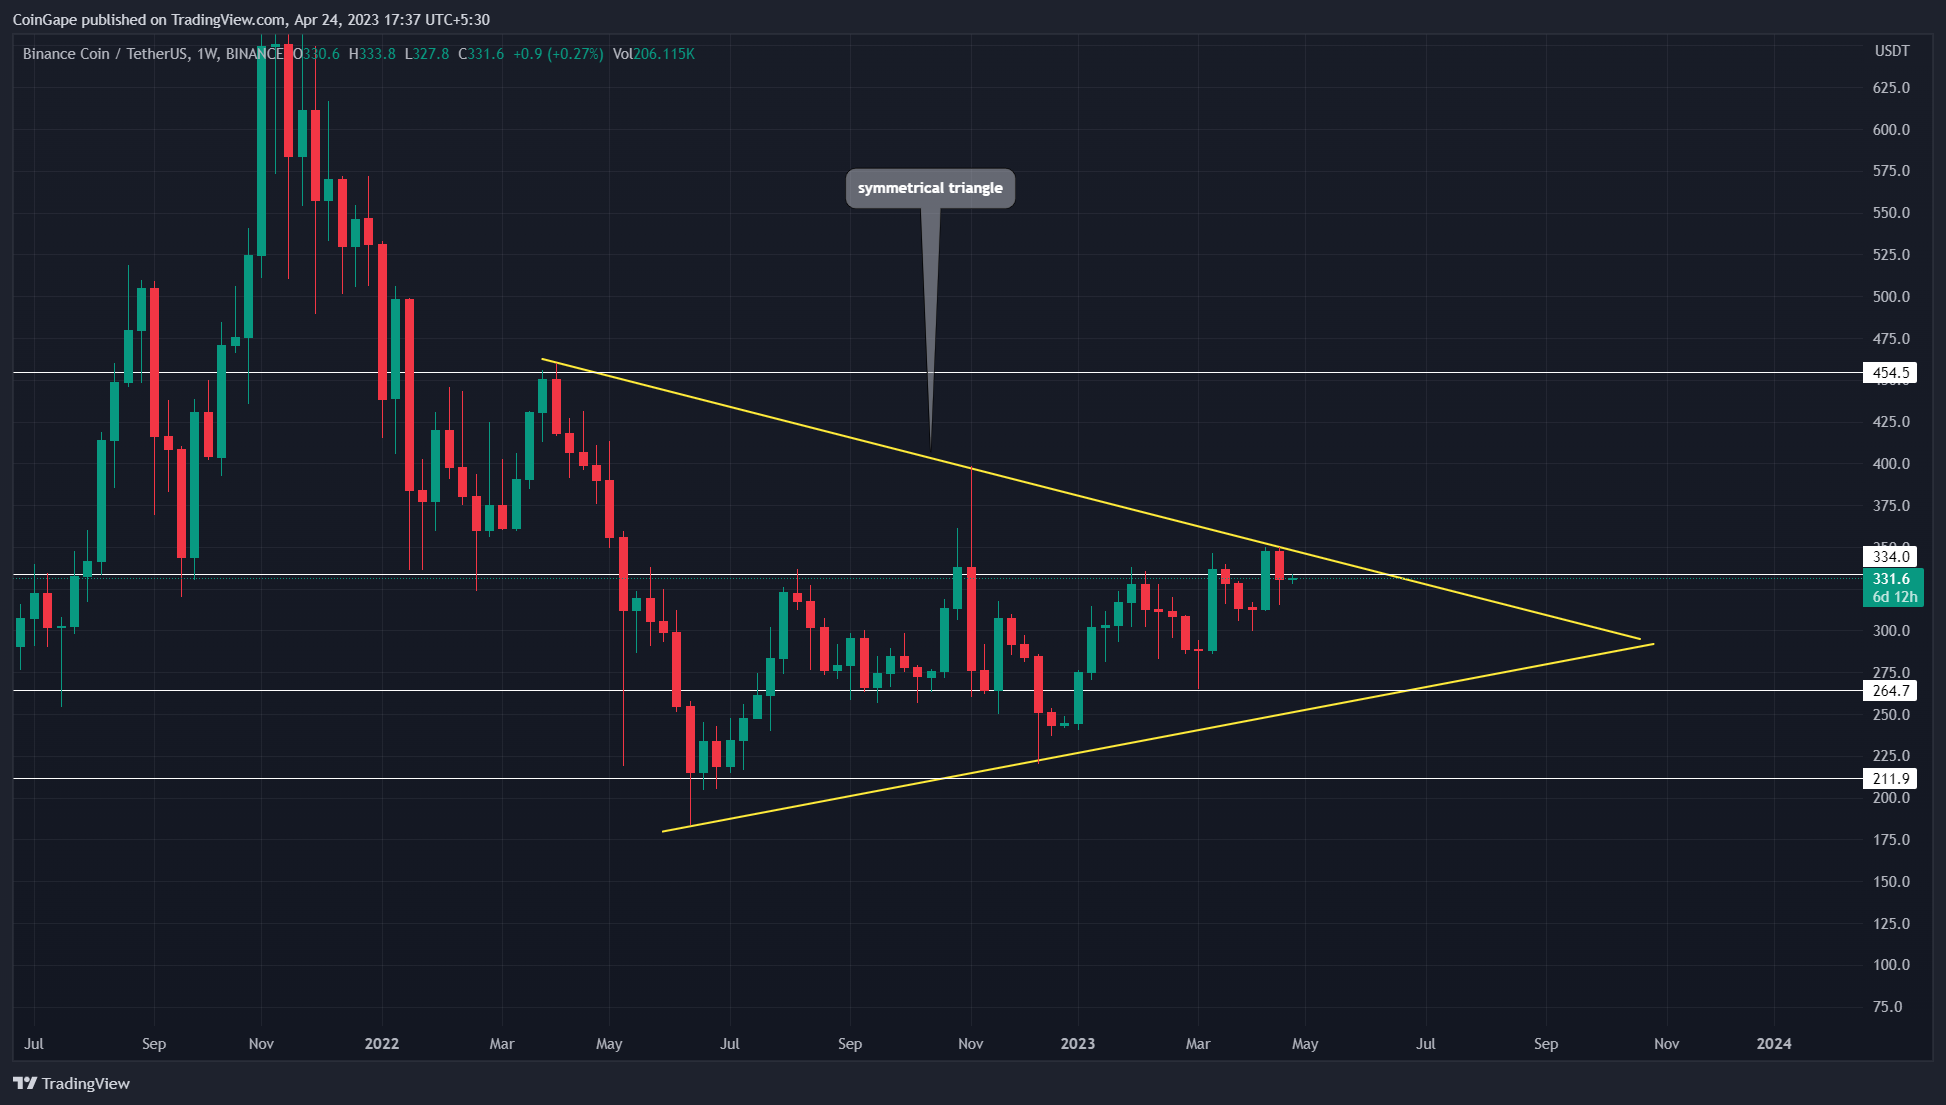
Source- Tradingview
In the weekly time frame chart, the Binance coin price shows the formation of a symmetrical triangle pattern. Under the influence of this pattern, the asset price resonated between two converging trendlines showcasing a steady sideways trend.
The coin price coiling narrow within the triangle is bound to break either of the given trendlines and trigger a direction rally. As of now, the BNB price trades at $329.8 with an intraday loss of 0.27%. Amid the recent sell-off in the market, the coin price turned down from the overhead resistance trendline is likely to hit the lower one.
Trending Stories
Until the lower trendline is intact, the BNB holders are safe from a massive downfall, however, a breakout above the resistance trendline is needed to start a new recovery rally.
Also Read: 15 New Cryptocurrencies In Upcoming Binance Listing For 2023
Solana (SOL)
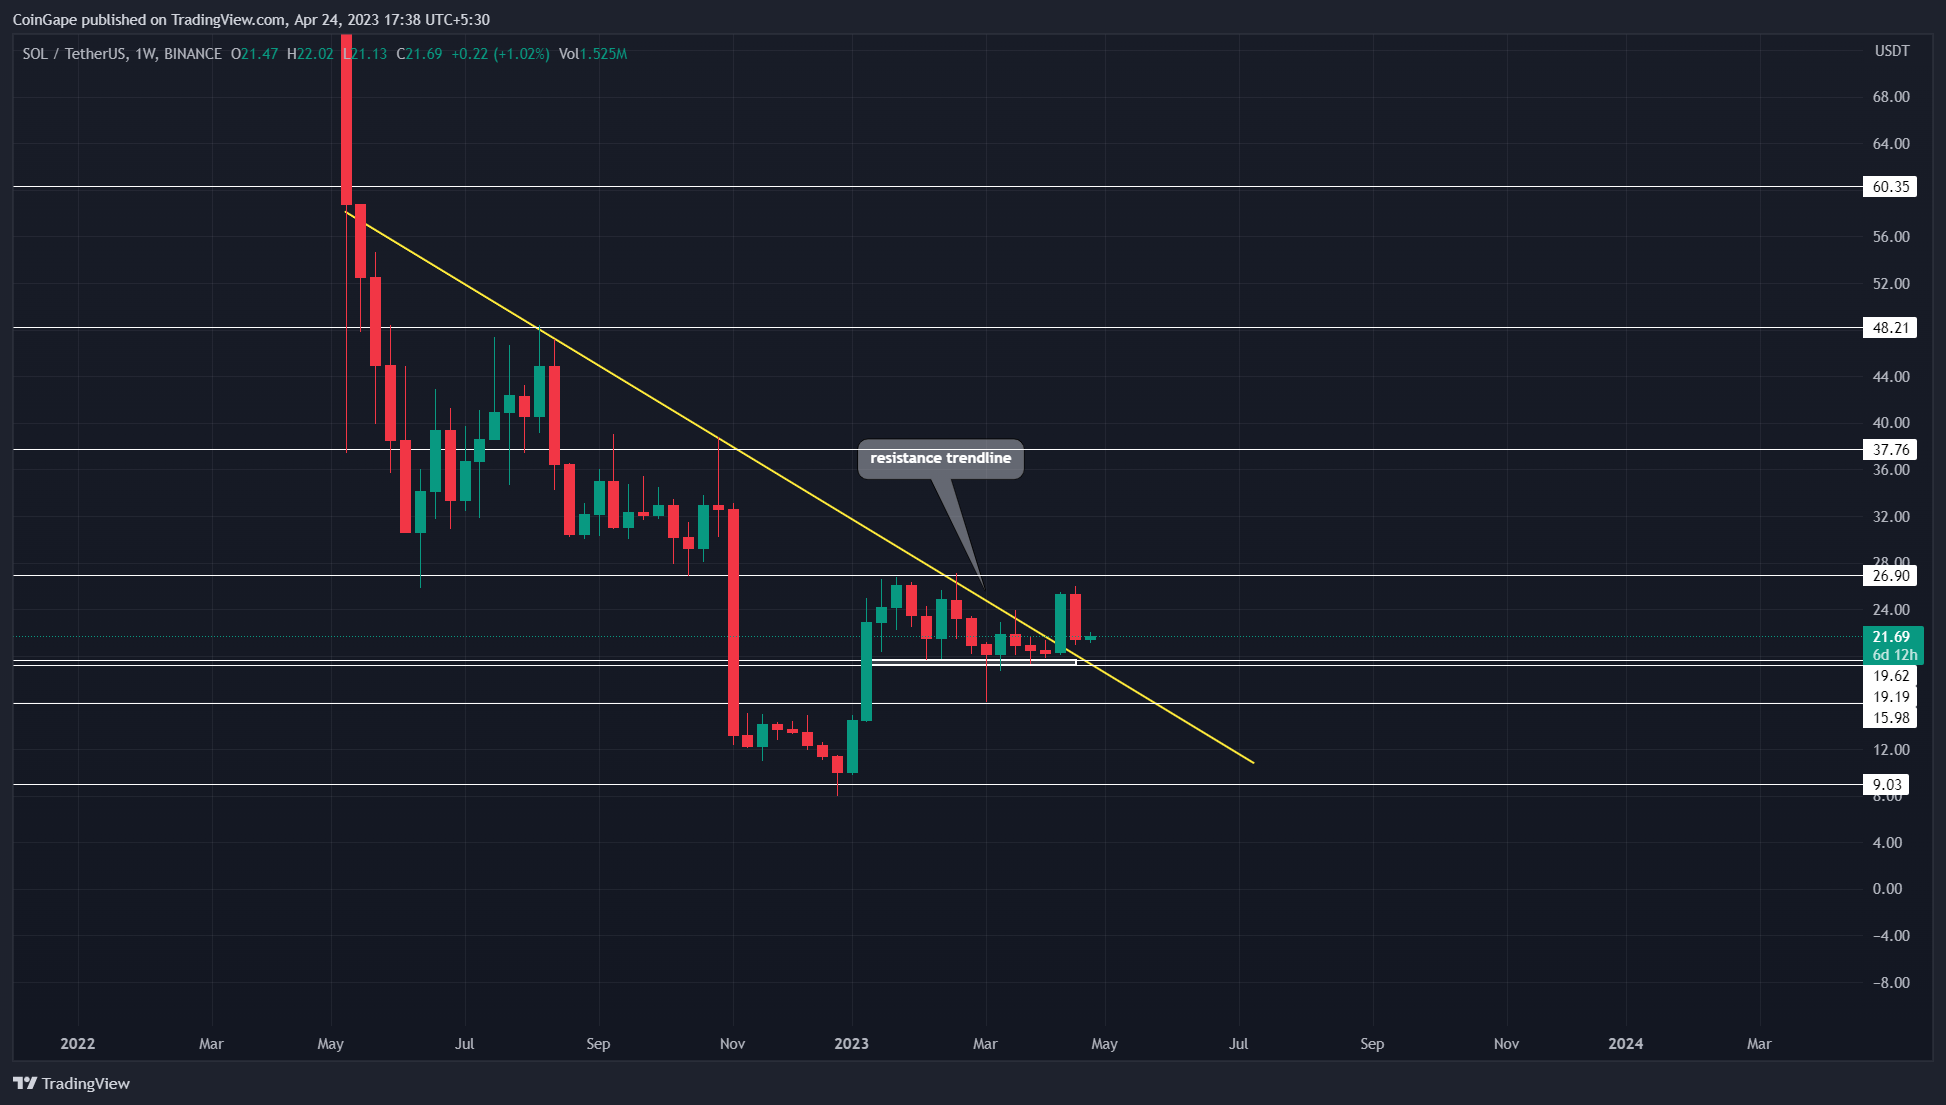
Source- Tradingview
On April 11th, the Solana coin price gave a massive breakout from a long-coming resistance trendline. After facing intense selling pressure at this dynamic resistance a breakout above was a sign of trend reversal.
However, with the increasing FUD in the market, the Solana price shows a minor pullback and retests the breached trendline as potential support. If the coin price shows sustainability above the trendline, it would mean the market sentiment shifted from selling on rallies to buying in dips.
Thus, the post-retest rally may drive the SOL price to a high of $37.75 mark.
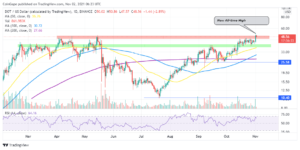
Polkadot (DOT)
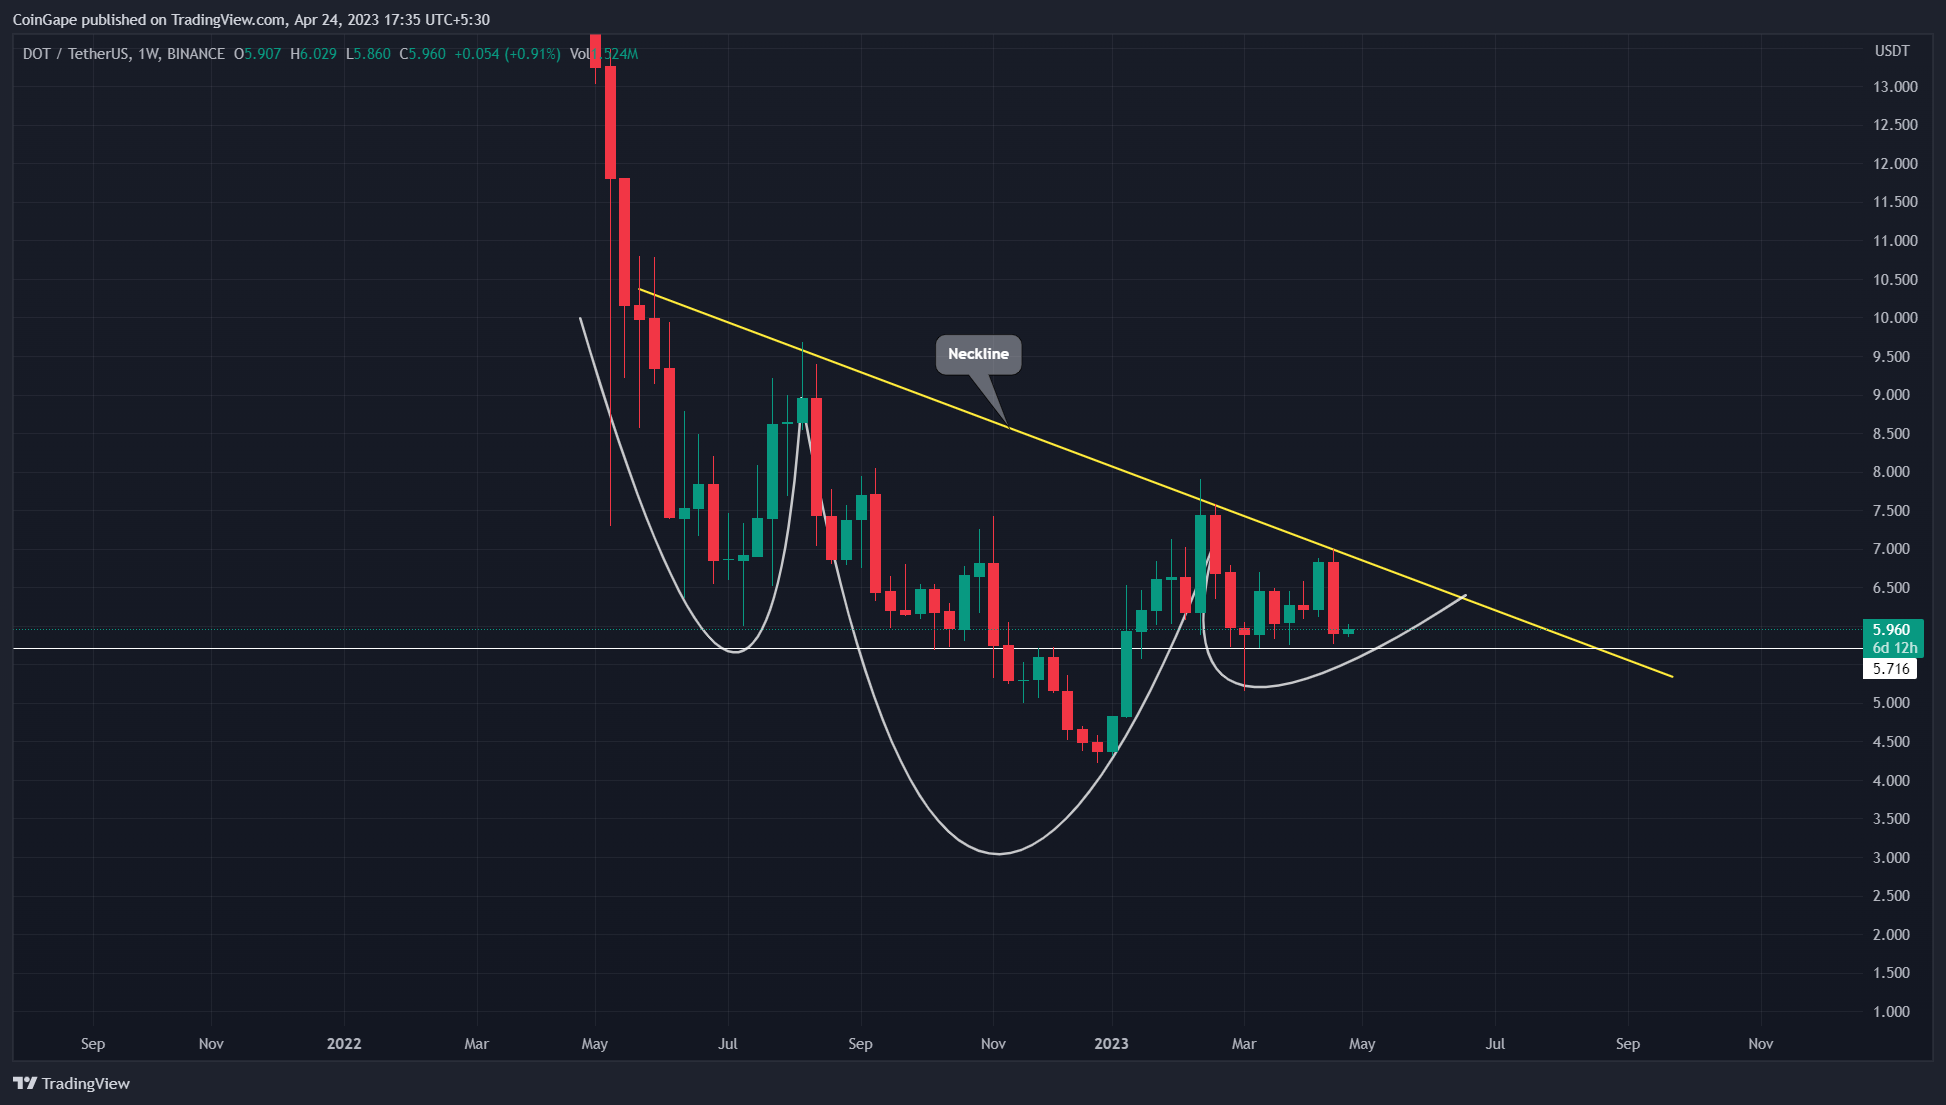
Source- Tradingview
In the weekly time frame chart, the Polkadot coin shows one of the famous trend reversal patterns called inverted head and shoulder. This pattern consists of a long swing low called the head and two minor swing longs called the shoulders.
Currently, the DOT price trades at $5.95 and shapes the right shoulder pattern of the pattern. Despite the rising selling pressure in the market, if the coin price manages to sustain above local support of $5.7, this pattern will encourage the altcoin to breach the overhead neckline resistance at $6.5
In ideal bullish conditions, a breakout of the resistance trendline may drive the DOT price to a high of $10.8
Share this article on:
advertisement
The presented content may include the personal opinion of the author and is subject to market condition. Do your market research before investing in cryptocurrencies. The author or the publication does not hold any responsibility for your personal financial loss.
<!– Close Story–>
- SEO Powered Content & PR Distribution. Get Amplified Today.
- Platoblockchain. Web3 Metaverse Intelligence. Knowledge Amplified. Access Here.
- Minting the Future w Adryenn Ashley. Access Here.
- Source: https://coingape.com/markets/3-best-altcoins-to-hold-despite-market-fud-rises/
- :is
- :not
- 1
- 10
- 20
- 7
- 8
- 9
- a
- above
- Ad
- After
- Altcoin
- Altcoins
- Amid
- an
- and
- any
- April
- ARE
- article
- AS
- asset
- At
- author
- avatar
- banner
- bearish
- Bearish Momentum
- Beauty
- before
- BEST
- between
- binance
- Binance Coin
- Binance Coin Price
- blockchain
- bnb
- bound
- breach
- Break
- breakout
- Brian
- Bullish
- Buying
- called
- CAN
- Chart
- Coin
- Coingape
- Coins
- COM
- condition
- conditions
- content
- converging
- correction phase
- crypto
- Crypto Market
- cryptocurrencies
- cryptocurrency
- Cryptocurrency Price
- Cryptocurrency Price Prediction
- Despite
- different
- direction
- do
- DOT
- dot price
- down
- downfall
- drive
- dynamic
- either
- encourage
- Entertainment
- Ether (ETH)
- facing
- Failed
- famous
- Fashion
- finance
- financial
- follow
- following
- For
- formation
- FRAME
- from
- FUD
- future
- given
- Have
- head
- High
- Hit
- hold
- holders
- HOURS
- However
- HTTPS
- i
- ideal
- in
- include
- Including
- increasing
- influence
- interested
- investing
- IT
- journalism
- jpg
- Last
- leading
- Level
- likely
- listing
- local
- Long
- loss
- Low
- major
- Majority
- manages
- mark
- Market
- market research
- market sentiment
- massive
- May..
- minor
- Momentum
- Near
- needed
- New
- now
- of
- on
- ONE
- Opinion
- or
- overall
- past
- Pattern
- patterns
- personal
- phase
- plato
- Plato Data Intelligence
- PlatoData
- plugin
- Polkadot
- potential
- prediction
- presented
- pressure
- price
- Price Prediction
- Publication
- pullback
- rallies
- rally
- reach
- Read
- recent
- recovery
- research
- Resistance
- responsibility
- retracement
- Reversal
- Rises
- rising
- safe
- sell-off
- Selling
- sentiment
- setup
- shapes
- Share
- show
- showcasing
- Shows
- sideways
- sign
- significant
- SOL
- SOL Price
- Solana
- solana coin
- Solana Price
- start
- steady
- strong
- subject
- support
- Sustainability
- Swing
- The
- The Weekly
- they
- this
- time
- to
- today
- Topics
- Traders
- trades
- TradingView
- Trend
- trending
- trigger
- triggered
- Turned
- under
- Undermine
- upcoming
- variety
- was
- weekly
- which
- will
- with
- within
- witnessed
- working
- would
- written
- years
- Your
- zephyrnet