15 Python Snippets to Optimize your Data Science Pipeline
Quick Python solutions to help your data science cycle.
By Lucas Soares, Machine Learning Engineer at K1 Digital

Photo by Carlos Muza on Unsplash
Why Snippets Matter for Data Science
In my daily routine I have to deal with a lot of the same situations from loading csv files to visualizing data. So, to help streamline my process I created the habit of storing snippets of code that are helpful in different situations from loading csv files to visualizing data.
In this post I will share 15 snippets of code to help with different aspects of your data analysis pipeline
1. Loading multiple files with glob and list comprehension
import glob
import pandas as pd
csv_files = glob.glob("path/to/folder/with/csvs/*.csv")
dfs = [pd.read_csv(filename) for filename in csv_files]
2. Getting unique values from a column table
import pandas as pd
df = pd.read_csv("path/to/csv/file.csv")
df["Item_Identifier"].unique()array(['FDA15', 'DRC01', 'FDN15', ..., 'NCF55', 'NCW30', 'NCW05'], dtype=object)
3. Display pandas dataframes side by side
from IPython.display import display_html
from itertools import chain,cycledef display_side_by_side(*args,titles=cycle([''])): # source: https://stackoverflow.com/questions/38783027/jupyter-notebook-display-two-pandas-tables-side-by-side html_str='' for df,title in zip(args, chain(titles,cycle(['</br>'])) ): html_str+='<th style="text-align:center"><td style="vertical-align:top">' html_str+="<br>" html_str+=f'<h2>{title}</h2>' html_str+=df.to_html().replace('table','table style="display:inline"') html_str+='</td></th>' display_html(html_str,raw=True)
df1 = pd.read_csv("file.csv")
df2 = pd.read_csv("file2")
display_side_by_side(df1.head(),df2.head(), titles=['Sales','Advertising'])
### Output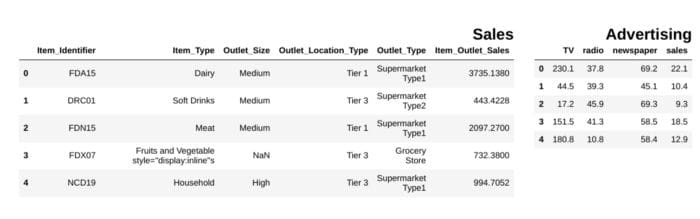
image by the author
4. Remove all NaNs in pandas dataframe
df = pd.DataFrame(dict(a=[1,2,3,None]))
df
df.dropna(inplace=True)
df
5. Show number of NaN entries in DataFrame columns
def findNaNCols(df): for col in df: print(f"Column: {col}") num_NaNs = df[col].isnull().sum() print(f"Number of NaNs: {num_NaNs}")
df = pd.DataFrame(dict(a=[1,2,3,None],b=[None,None,5,6]))
findNaNCols(df)# OutputColumn: a
Number of NaNs: 1
Column: b
Number of NaNs: 2
6. Transforming columns with .apply and lambda functions
df = pd.DataFrame(dict(a=[10,20,30,40,50]))
square = lambda x: x**2
df["a"]=df["a"].apply(square)
df
7. Transforming 2 DataFrame columns into a dictionary
df = pd.DataFrame(dict(a=["a","b","c"],b=[1,2,3]))
df_dictionary = dict(zip(df["a"],df["b"]))
df_dictionary{'a': 1, 'b': 2, 'c': 3}
8. Plotting grid of distributions with conditionals on columns
import numpy as np
import matplotlib.pyplot as plt
import seaborn as sns
sns.set()
import pandas as pd df = pd.DataFrame(dict(a=np.random.randint(0,100,100),b=np.arange(0,100,1)))
plt.figure(figsize=(15,7))
plt.subplot(1,2,1)
df["b"][df["a"]>50].hist(color="green",label="bigger than 50")
plt.legend()
plt.subplot(1,2,2)
df["b"][df["a"]<50].hist(color="orange",label="smaller than 50")
plt.legend()
plt.show()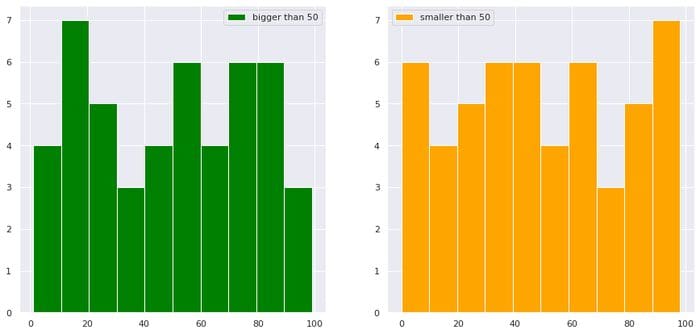
image by the author
9. Running t-tests for values of different columns in pandas
from scipy.stats import ttest_rel data = np.arange(0,1000,1)
data_plus_noise = np.arange(0,1000,1) + np.random.normal(0,1,1000)
df = pd.DataFrame(dict(data=data, data_plus_noise=data_plus_noise))
print(ttest_rel(df["data"],df["data_plus_noise"]))# Output
Ttest_relResult(statistic=-1.2717454718006775, pvalue=0.20375954602300195)
10. Merging dataframes on a given column
df1 = pd.DataFrame(dict(a=[1,2,3],b=[10,20,30],col_to_merge=["a","b","c"]))
df2 = pd.DataFrame(dict(d=[10,20,100],col_to_merge=["a","b","c"]))
df_merged = df1.merge(df2, on='col_to_merge')
df_merged
11. Normalizing values in a pandas column with sklearn
from sklearn.preprocessing import MinMaxScaler
scaler = MinMaxScaler()
scores = scaler.fit_transform(df["a"].values.reshape(-1,1))
12. Dropping NaNs in a specific column in pandas
df.dropna(subset=["col_to_remove_NaNs_from"],inplace=True)13. Selecting subset of a dataframe with conditionals and or statement
df = pd.DataFrame(dict(result=["Pass","Fail","Pass","Fail","Distinction","Distinction"]))
pass_index = (df["result"]=="Pass") | (df["result"]=="Distinction")
df_pass = df[pass_index]
df_pass
14. Basic pie chart
import matplotlib.pyplot as plt df = pd.DataFrame(dict(a=[10,20,50,10,10],b=["A","B","C","D","E"]))
labels = df["b"]
sizes = df["a"]
plt.pie(sizes, labels=labels, autopct='%1.1f%%', shadow=True, startangle=140)
plt.axis('equal')
plt.show()
15. Changing a percentage string to a numerical value using .apply()
def change_to_numerical(x): try: x = int(x.strip("%")[:2]) except: x = int(x.strip("%")[:1]) return x df = pd.DataFrame(dict(a=["A","B","C"],col_with_percentage=["10%","70%","20%"]))
df["col_with_percentage"] = df["col_with_percentage"].apply(change_to_numerical)
df
Conclusion
I think snippets of code are super valuable, rewriting code can be a real waste of time so having a complete toolkit with all the simple solutions you need to streamline your data analysis process can be of great help.
If you liked this post connect with me on Twitter, LinkedIn and follow me on Medium. Thanks and see you next time! :)
More content at plainenglish.io
Bio: Lucas Soares is an AI engineer working on deep learning applications to a wide range of problems.
Original. Reposted with permission.
Related:
- '
- "
- &
- 100
- 7
- Advertising
- AI
- All
- analysis
- Application
- applications
- auto
- AWS
- code
- Column
- Common
- content
- data
- data analysis
- data science
- deal
- deep learning
- Director
- engineer
- Features
- First
- follow
- GPUs
- great
- Green
- Grid
- How
- How To
- HTTPS
- Interview
- Labels
- LEARN
- learning
- List
- machine learning
- medium
- ML
- Neural
- open
- open source
- Python
- range
- reasons
- regression
- running
- sales
- Science
- scientists
- Share
- Simple
- So
- Solutions
- square
- stats
- Stories
- TD
- Testing
- time
- top
- transforming
- value
- X